Sugar Usage Analysis Area Graph – Revenue Projections and Market Analysis
RJ0400034_8
- Last Update 05/26/2025
- File Size 2.2MB
- # of Slides 2
- File Format PPTX
- Slide Ratio 16:9
- Color
Keywords
- #Content-Based Slides
- #Design-Based Slides
- #Business Strategy
- #Market and Competitor Analysis
- #Graph
- #Financial Outlook & Expected Impact
- #Market Analysis
- #16:9
- #area chart PowerPoint slide
- #market analysis data visualization
- #revenue trend graph PPT
- #time series data presentation
- #how to create area chart in PowerPoint
About the Product
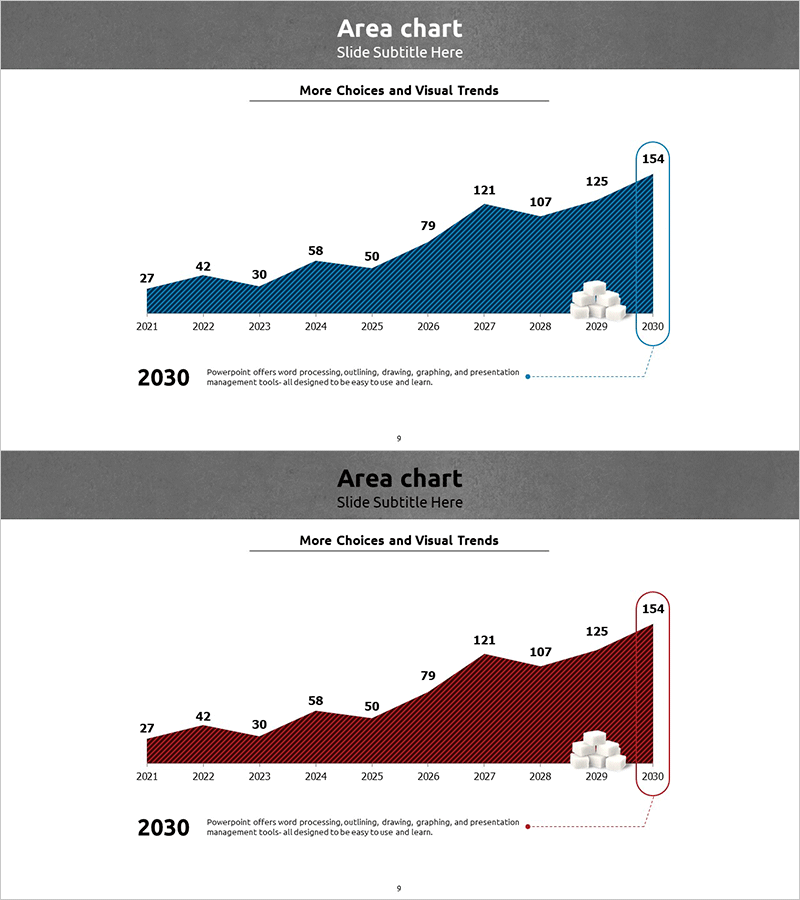
A PowerPoint slide featuring an area chart displaying market growth trends from 2021 to 2030. The chart uses a dark blue diagonal pattern fill to emphasize the data area, with clear year-by-year value labels (27, 42, 30, 58, 50, 79, 121, 107, 125, 154) positioned above each data point. The slide includes a title section 'More Choices and Visual Trends' at the top and a descriptive text area for context. Designed for market analysis, business strategy presentations, and revenue forecasting reports. Provided in 16:9 widescreen PPTX format with fully editable chart data and text elements.
Usage Points
-
Main Usage
This slide is designed to present quantitative time-series data such as annual growth, market size changes, and revenue trends at a glance. The area chart format effectively displays both overall market scale and individual item fluctuations simultaneously, making it ideal for supporting data-driven decision-making.
-
How to Use
Insert this slide into business plans, investor pitch decks, or market analysis reports in the market overview or growth forecast sections. Replace the chart data with your actual figures, update the title and description text to match your presentation context, and you're ready to present. Two color versions (dark blue and wine red) are included.
-
Recommended For
Recommended for executives, financial analysts, marketing strategists, and consultants who need to support data-driven decisions. Particularly effective for quarterly or annual performance reports, market share evolution, revenue growth rates, and other metrics requiring persuasive visual communication.
-
Slide Structure
The slide layout consists of a title area with gray background at the top, a centered area chart with dark blue or wine red diagonal pattern fill, a highlighted 2030 year box on the right, and a descriptive text section at the bottom. Three distinct text input areas (title, description, year labels) and the chart data area are clearly separated for easy editing.
Related Products
-

Visualizing the Changing Trend of the Ageing Population with a 100% Stacked Bar Graph
#Business Strategy #Market and Competitor Analysis #Marketing Plan and Strategy
-

Highlighted Line Charts and Tables – Market Analysis and Revenue Forecast
#Business Strategy #Market and Competitor Analysis #Diagram
-

Expected Effects Based on Market Analysis – Insights Visualized by Data
#Business Strategy #Market and Competitor Analysis #Diagram
-

Science Market Analysis Bundled Bar Graph
#Market and Competitor Analysis #Graph #Competitor Analysis
