A Continuously Growing Broken Line Graph – Market Trends and Future Outlook
RJ0300072_7
- Last Update 05/08/2025
- File Size 0.3MB
- # of Slides 2
- File Format PPTX
- Slide Ratio 16:9
- Color
Keywords
About the Product
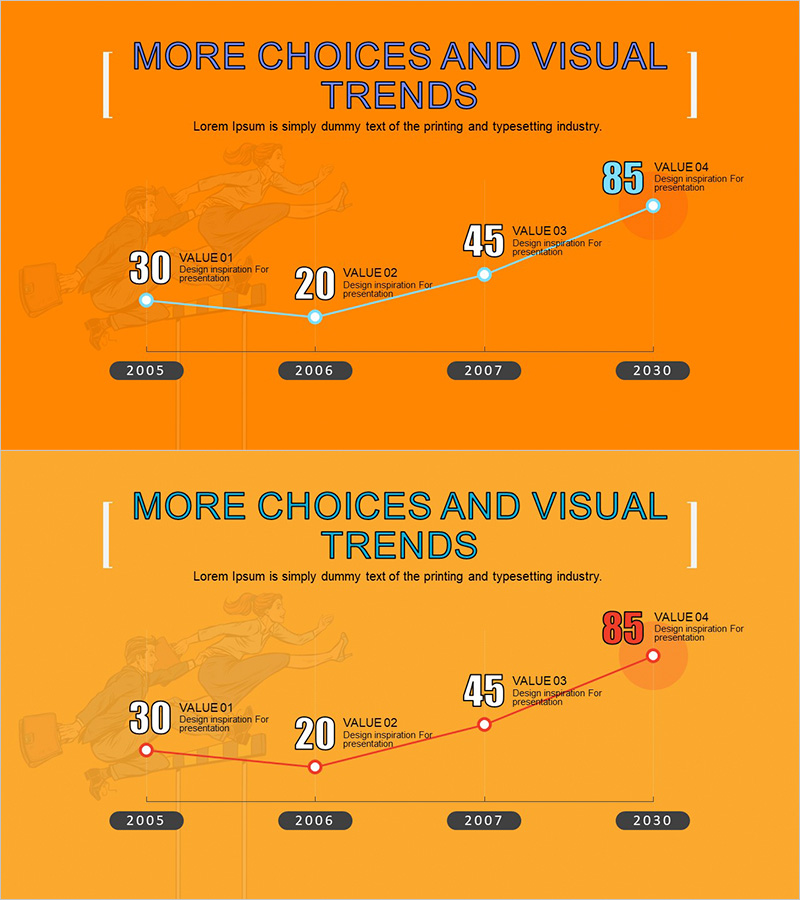
A professional line graph PowerPoint slide that visualizes market trends and future outlook with four data points spanning from 2005 to 2030. The slide features a white broken line with circular data markers on an orange background, clearly displaying growth progression (30→20→45→85). Each data point includes value labels and descriptive text areas, making it ideal for presenting competitive analysis, revenue trends, market share changes, and other business metrics. The 2-slide set includes a variation with a lighter orange background tone, providing flexibility for different presentation contexts and visual consistency throughout your deck.
Usage Points
-
Main Usage
Effectively visualizes numerical changes and growth trends over time, making it ideal for presenting market analysis, competitive comparisons, revenue progression, customer growth rates, and market share evolution in a clear, professional manner.
-
How to Use
Replace the data point values with your actual figures and update the year labels to match your timeline. Customize the line and background colors to align with your brand identity, and modify the descriptive text boxes to highlight key insights and business implications.
-
Recommended For
Recommended for executive reports, investor presentations (IR), business plans, marketing proposals, quarterly performance reviews, and market analysis documents. Ideal for professionals including executives, marketing managers, sales leaders, and business analysts who need to communicate data-driven growth narratives.
-
Slide Structure
Two-slide set with each slide featuring an orange background, four connected data points forming a broken line, circular markers at each point, value labels (30, 20, 45, 85), year labels (2005, 2006, 2007, 2030), and explanatory text areas. The first slide uses a darker orange tone while the second features a lighter shade for visual variation.
Related Products
-

Future Outlook Chart for Renewable Energy Business – Market Trend Analysis
#Market and Competitor Analysis #Graph #Future Outlook
-

Market Trends and Competitor Analysis Chart – Emphasizing Future Outlook
#Market and Competitor Analysis #Graph #Future Outlook
-

Line Graph for Market Trend Analysis – Insights for Education
#Market and Competitor Analysis #Graph #Future Outlook
-

Online Presentation Template Line Chart – Market Trends and Visualization
#Market and Competitor Analysis #Graph #Future Outlook
