Diagram Explaining Tooth Decay Causes - Starting Effective Treatment
RJ0400034_4
- Last Update 05/26/2025
- File Size 2.2MB
- # of Slides 2
- File Format PPTX
- Slide Ratio 16:9
- Color
Keywords
- #Content-Based Slides
- #Design-Based Slides
- #Product/Service Introduction
- #Operational Plan
- #Diagram
- #Product/Service Introduction
- #Business Support Plan
- #Flow
- #Cluster
- #Linear Flow
- #Combination Diagram
- #16:9
- #nested diagram PowerPoint
- #cause-effect diagram slide
- #3-step process flow
- #circular node diagram
- #medical education PowerPoint slide
About the Product
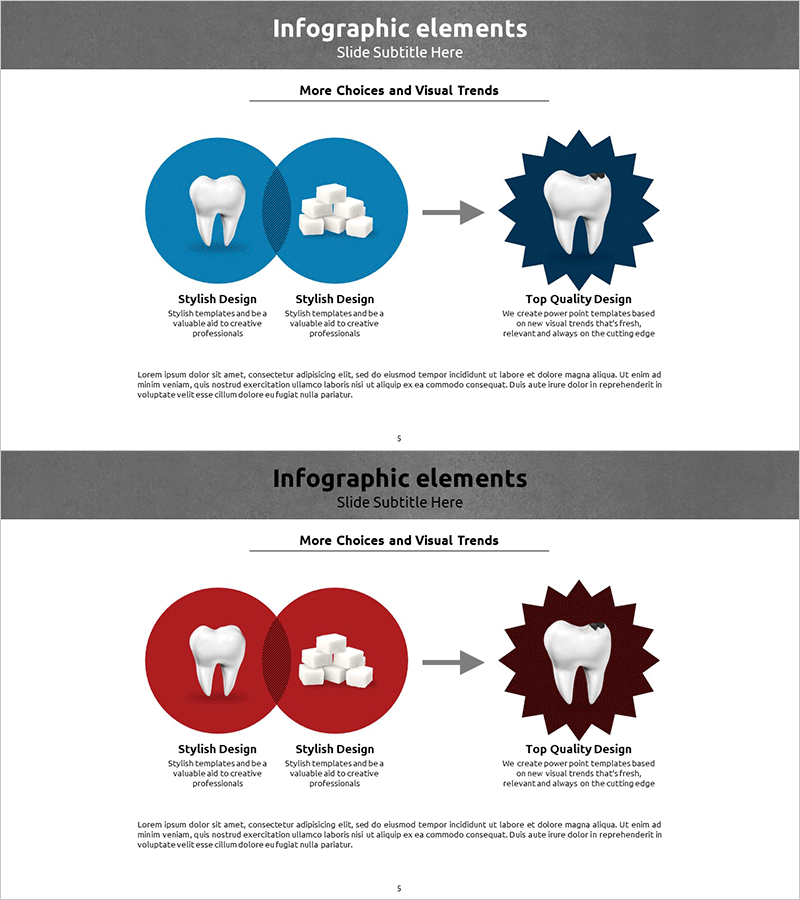
A nested diagram PowerPoint slide that visually represents cause-and-effect relationships through a convergent flow structure. Two circular nodes on the left connect via arrows to a final star-shaped node on the right, making it ideal for medical education, problem analysis, and solution presentation. Provided in two color versions—blue and burgundy—each slide includes icons and editable text areas for immediate customization. Compatible with all PowerPoint versions in 16:9 PPTX format.
Usage Points
-
Main Usage
Optimized for explaining problems, causes, and solutions in a step-by-step visual format. Widely used in medical presentations for disease explanation, educational settings for concept delivery, and business proposals for problem analysis and solution presentation.
-
How to Use
Enter causes or background information in the two left circular nodes and the final result or solution in the right star-shaped node. Replace icons and text in each node to match your presentation topic. Select the color version that aligns with your presentation tone.
-
Recommended For
Recommended for healthcare professionals, educators, consultants, and marketing specialists presenting problem analysis and solution frameworks. Particularly effective for diagnostic and treatment processes, learning concept explanations, and business problem-solving presentations.
-
Slide Structure
2-slide deck. Slide 1: Blue background with nested diagram (2 left circular nodes + connecting arrows + 1 right star node, each with icon and text area). Slide 2: Burgundy background with identical structure. 16:9 aspect ratio, PPTX format.
Related Products
-

Camping Isometric Production and Technology Development Strategy – Innovative Approach
#Product/Service Introduction #Diagram #Product/Service Introduction
-

Meat Analysis Overlapping Diagram - Product and Service Introduction
#Product/Service Introduction #Technical Approach #Diagram
-

Simple Circle Presentation Template Diagram – Emphasizing Operations and Flow
#Operational Plan #Diagram #Organizational Structure and Staffing Plan
-

Fashion List and Side Table - Visualizing Product Features
#Product/Service Introduction #Diagram #Product/Service Introduction
