AI Business Strategy Diagram – A Visual Solution for Effective Business Execution
RJ0700017_6
- Last Update 10/07/2025
- File Size 0.6MB
- # of Slides 2
- File Format PPTX
- Slide Ratio 16:9
- Color
Keywords
- #Content-Based Slides
- #Design-Based Slides
- #Business Vision and Strategy
- #Marketing Plan and Strategy
- #Diagram
- #Business Strategy
- #Marketing Strategy
- #Flow
- #Cluster
- #Linear Flow
- #Combination Diagram
- #16:9
- #nested diagram PowerPoint
- #process flow slide template
- #3-stage cycle diagram
- #business strategy visualization
- #arrow flowchart slide design
About the Product
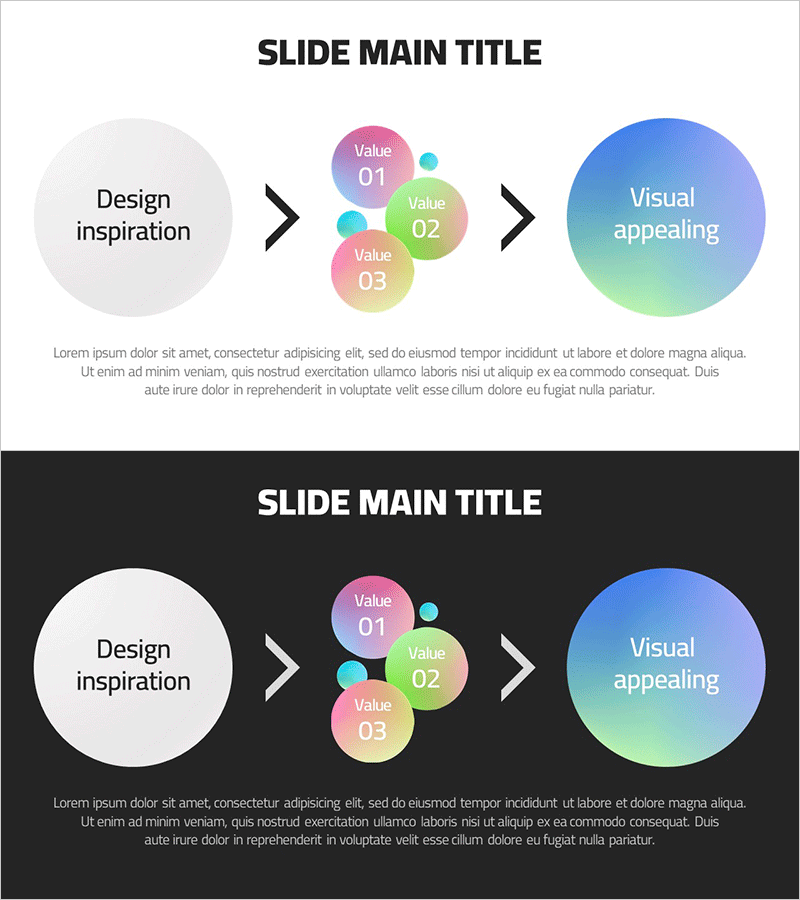
A nested diagram PowerPoint slide that visualizes business strategy and process flow through interconnected circular nodes. The design flows from a left-side circle through three layered nodes in the center, converging into a large right-side circle with black arrow connectors. Features pink, lime, and cyan gradient-filled circles with clear directional arrows showing sequential progression. Delivered in 16:9 PPTX format with 2 slides, fully editable for business execution phases, decision-making workflows, and strategic planning presentations.
Usage Points
-
Main Usage
Visualizes multi-stage business processes, strategic planning workflows, and decision-making sequences. The left circle represents initial input, three center nodes show intermediate review stages, and the right circle displays final outcomes—all connected by directional arrows for clear progression.
-
How to Use
Use in business strategy presentations, executive briefings, and project kickoff meetings to explain end-to-end process flows. Edit node text to add specific phase names, responsible departments, and timelines. Customize circle colors to match corporate branding or department themes.
-
Recommended For
Executives, strategy managers, project managers, and consultants presenting business plans, organizational restructuring, or process improvement initiatives. Particularly effective for explaining multi-stage decision structures, sequential execution plans, and phase-based performance validation.
-
Slide Structure
2-slide set includes light background and dark background versions. Each slide features a left input circle, three-layer center processing nodes, large right output circle, and black arrow connectors. All text fields and colors are fully editable for customization.
Related Products
-

Chromosome Theme Business Strategy Diagram
#Business Vision and Strategy #Marketing Plan and Strategy #Diagram
-

Mobile Service Business Step-by-Step Strategy – Efficient Future Design
#Business Vision and Strategy #Marketing Plan and Strategy #Diagram
-

Corporate Strategy Diagram Leading the Future – Visualizing Business Flow
#Business Vision and Strategy #Marketing Plan and Strategy #Diagram
-

Business Strategy Overlay Diagram – Effective Strategy Visualization
#Business Vision and Strategy #Marketing Plan and Strategy #Diagram
