Crop Analysis Donut Circle Graph
RJ0400031_16
- Last Update 05/26/2025
- File Size 8.1MB
- # of Slides 2
- File Format PPTX
- Slide Ratio 16:9
- Color
Keywords
- #Content-Based Slides
- #Design-Based Slides
- #Market and Competitor Analysis
- #Graph
- #Market Share
- #Circles
- #Doughnut Chart
- #16:9
- #donut chart PowerPoint slide
- #pie chart template download
- #market share analysis visualization
- #crop data presentation
- #4-segment donut graph
- #competitive analysis slide
- #how to create donut chart in PowerPoint
About the Product
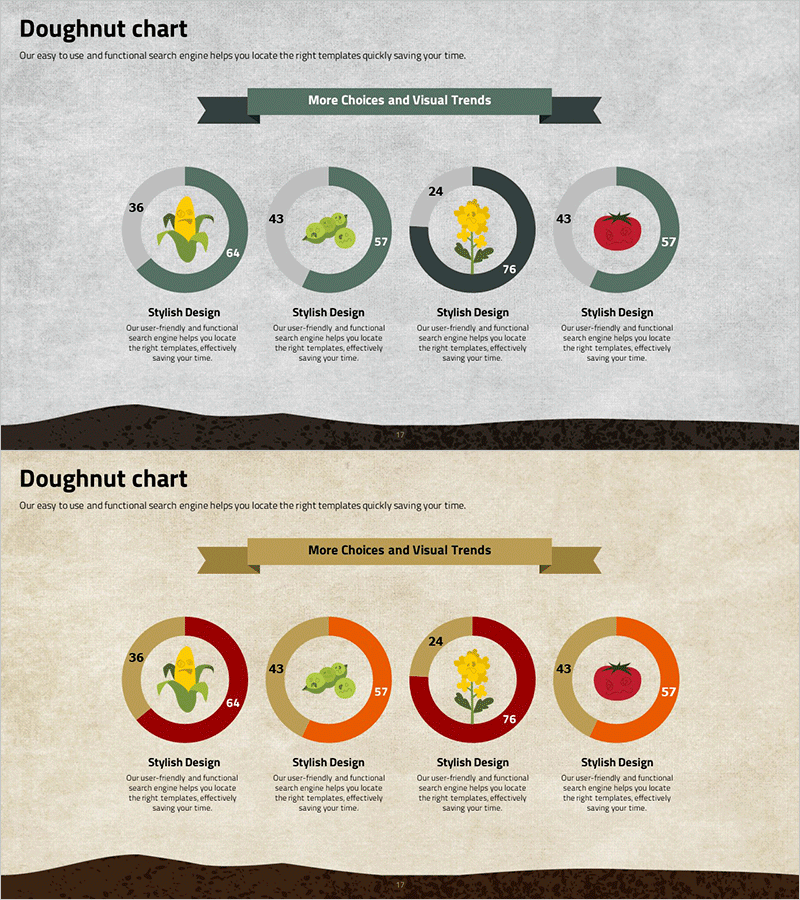
A 4-segment donut chart PowerPoint slide designed for visualizing crop market share and competitive analysis. The donut-shaped chart uses four distinct colors—green, orange, red, and tan—to represent each data segment with clear numerical values. The center of the donut provides space for key metrics, while descriptive text labels are positioned below each chart for detailed context. This 2-slide template is fully editable and optimized for 16:9 widescreen presentations, making it ready for immediate use in business reports and market analysis presentations.
Usage Points
-
Main Usage
Visualizes four-category ratio data such as crop market share, competitor percentages, sales composition, and distribution channels. The donut format emphasizes proportional relationships while the center space highlights key metrics, drawing audience attention to critical data points with supporting text descriptions below.
-
How to Use
Apply this template to agricultural industry presentations, market analysis reports, and executive briefings. Simply replace the chart colors and numerical values with your own data, update the item labels at the bottom, and adjust the segment sizes accordingly. The 2-slide format allows you to present multiple scenarios or time-period comparisons side by side.
-
Recommended For
Agricultural company executives, food distribution managers, market analysts, investment presentation speakers, and academic researchers presenting quantitative data. Ideal for any presentation requiring clear visual comparison of market segments, competitive positioning, or categorical distribution analysis.
-
Slide Structure
Each slide features a header banner with title, a central 4-segment donut chart with numerical values displayed on each segment, and four descriptive text areas positioned below. The donut segments use green, orange, red, and tan colors, with arc thickness proportional to data values. The hollow center provides space for emphasis text or key metrics.
Related Products
-

Watercolor Customer Analysis Donut Chart – Visualizing Market Share
#Market and Competitor Analysis #Graph #Market Share
-

Market Share Donut Chart for Eco-Friendly Businesses – Trends and Insights
#Market and Competitor Analysis #Graph #Market Share
-

Soccer Match Analysis Chart – Performance Analysis and Future Forecast
#Business Vision and Strategy #Market and Competitor Analysis #Graph
-

Causes of Fire Donut Chart – Visualizing Market Analysis
#Market and Competitor Analysis #Graph #Market Share
