Crop Analysis Vertical Bar Graph Table
RJ0400031_13
- Last Update 05/26/2025
- File Size 8MB
- # of Slides 2
- File Format PPTX
- Slide Ratio 16:9
- Color
Keywords
- #Content-Based Slides
- #Design-Based Slides
- #Market and Competitor Analysis
- #Diagram
- #Graph
- #Market Analysis
- #Table
- #Column
- #Column Chart
- #16:9
- #vertical bar chart PowerPoint
- #crop analysis presentation
- #data visualization slide
- #market comparison graph
- #business analysis PPT slide
- #how to create bar chart in PowerPoint
About the Product
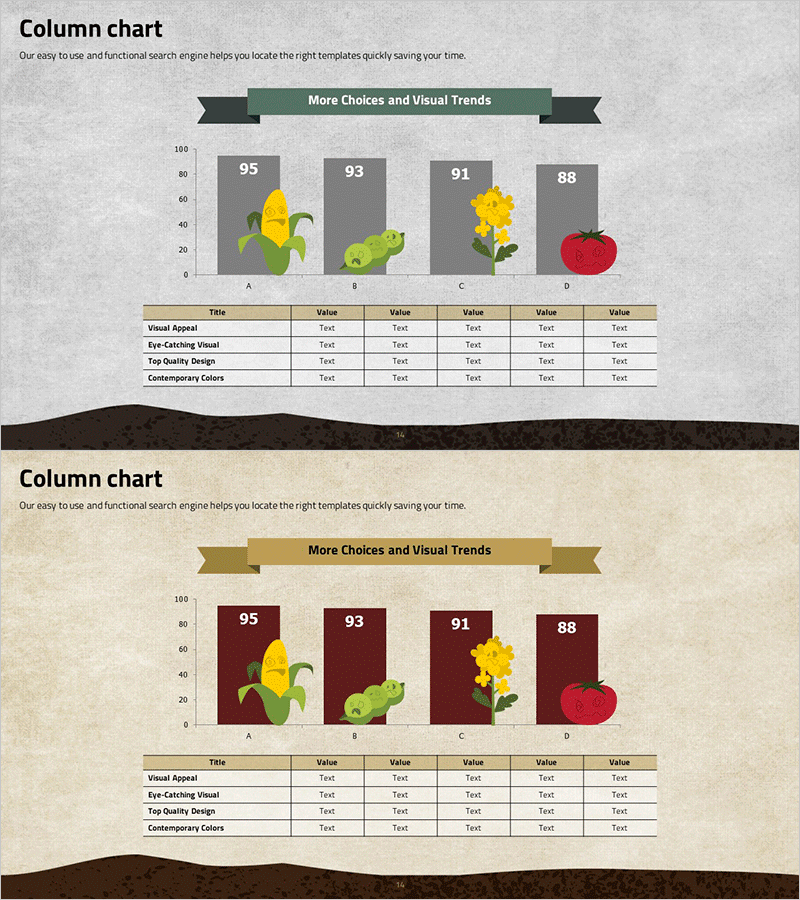
A vertical bar chart PowerPoint slide optimized for crop market analysis and competitive product comparison. This presentation template displays numerical data for four agricultural items—corn, cucumber, sunflower, and tomato—using vertical bars against a gray background, with illustrations positioned above each bar to enhance visual comprehension. The lower section includes a data table summarizing market analysis metrics (visual appeal, eye-catching elements, quality design, contemporary colors), enabling simultaneous delivery of quantitative and qualitative insights. Formatted in 16:9 aspect ratio PPTX with 2 slides, this template is ready for immediate use in agricultural presentations, market research reports, and product comparison analyses.
Usage Points
-
Main Usage
Visualizes quantitative data for agricultural market analysis, competitive product comparison, and sales trend evaluation. The vertical bar format allows instant comparison of four data points, while the accompanying table presents additional evaluation metrics for comprehensive analysis.
-
How to Use
Deploy in agricultural business presentations, market research reports, product development meetings, and investor pitch decks to support data-driven decision-making. Edit bar heights and table values with actual data to create credible analytical materials.
-
Recommended For
Agricultural enterprises, food distribution companies, marketing professionals, market analysts, and executives preparing data-backed reports. Ideal for any presentation requiring quantitative comparative analysis to enhance data credibility.
-
Slide Structure
Slide 1: Title area + 4-item vertical bar chart (gray background, numeric labels, 4 illustrations). Slide 2: Identical chart + data table below (5 rows × 6 columns with visual appeal, eye-catching, quality design, and color trend metrics). 16:9 aspect ratio, PPTX format.
Related Products
-

Market Trend Analysis Bar Graph & Table
#Market and Competitor Analysis #Diagram #Graph
-

Global Target Market Analysis Graph
#Market and Competitor Analysis #Diagram #Graph
-

Comparative Analysis Bar Graph & Table – Optimized for Market and Competitor Analysis
#Market and Competitor Analysis #Diagram #Graph
-

Market Trends and Analysis – Harmony of Blue and Red
#Market and Competitor Analysis #Diagram #Graph
