Market Trend Analysis Bar Graph & Table
RM0700002_7
- Last Update 02/25/2025
- File Size 0.2MB
- # of Slides 2
- File Format PPTX
- Slide Ratio 16:9
- Color
Keywords
- #Content-Based Slides
- #Design-Based Slides
- #Market and Competitor Analysis
- #Diagram
- #Graph
- #Market Analysis
- #Industry Trends
- #Table
- #Column
- #Standard Table
- #Column Chart
- #16:9
- #market trend bar chart PowerPoint
- #vertical bar graph presentation
- #market analysis slide template
- #data visualization table
- #trend analysis PowerPoint download
About the Product
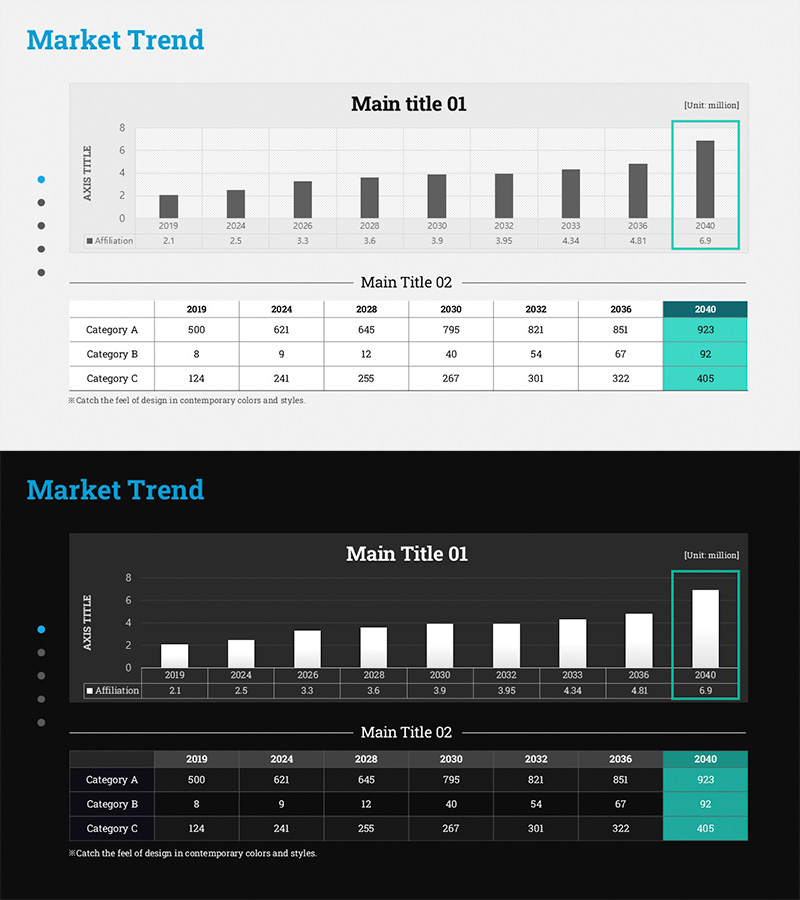
A 2-slide PowerPoint presentation for visualizing market trends with professional data representation. The first slide features a vertical bar chart displaying 10-year trend data from 2019 to 2040, with a teal highlight box emphasizing the latest value. The second slide presents a comprehensive data table organized by category, using consistent teal color scheme for visual cohesion. Delivered in 16:9 widescreen PPTX format, fully editable and ready for immediate use in market analysis reports, investor presentations, business reviews, and strategic planning documents.
Usage Points
-
Main Usage
Clearly communicate market size, sales trends, and category performance over time through visual data representation. The bar chart enables intuitive year-over-year comparison while the table provides precise numerical details, creating a credible and comprehensive analytical presentation.
-
How to Use
Insert into business reports' market overview sections, investor pitch decks' performance analysis pages, or marketing strategy documents' market sizing discussions. Replace chart values and table data with your actual statistics to create a professional, customized presentation in minutes.
-
Recommended For
Executives, marketing managers, business strategists, investment professionals, and consultants requiring data-driven decision-making support. Ideal for quarterly performance reviews, annual business planning presentations, new venture proposals, and competitive market analysis briefings.
-
Slide Structure
Slide 1: Title area + vertical bar chart (10 data points across years) + legend + value labels + teal highlight box (latest value 6.9). Slide 2: Title area + 3-row × 8-column data table (Categories A, B, C with year-by-year figures) + teal header and accent cells. Full 16:9 aspect ratio with unified color scheme throughout.
Related Products
-

Bar Graph for Market Trend Analysis – Effective Market Insights
#Market and Competitor Analysis #Graph #Market Analysis
-

Competitor and Market Analysis Slide Design - Harmony of Blue and Yellow
#Market and Competitor Analysis #Diagram #Graph
-

Mobile Market Analysis Bar & Line Charts – Trend Visualization
#Market and Competitor Analysis #Graph #Market Analysis
-

Market Analysis Graphs & Tables – Visualizing Sales Growth
#Market and Competitor Analysis #Financial Plans and Performance #Diagram
