Bar Graph of Births by Year – Market Trends and Future Projections
RJ0400030_14
- Last Update 05/25/2025
- File Size 8.7MB
- # of Slides 2
- File Format PPTX
- Slide Ratio 16:9
- Color
Keywords
About the Product
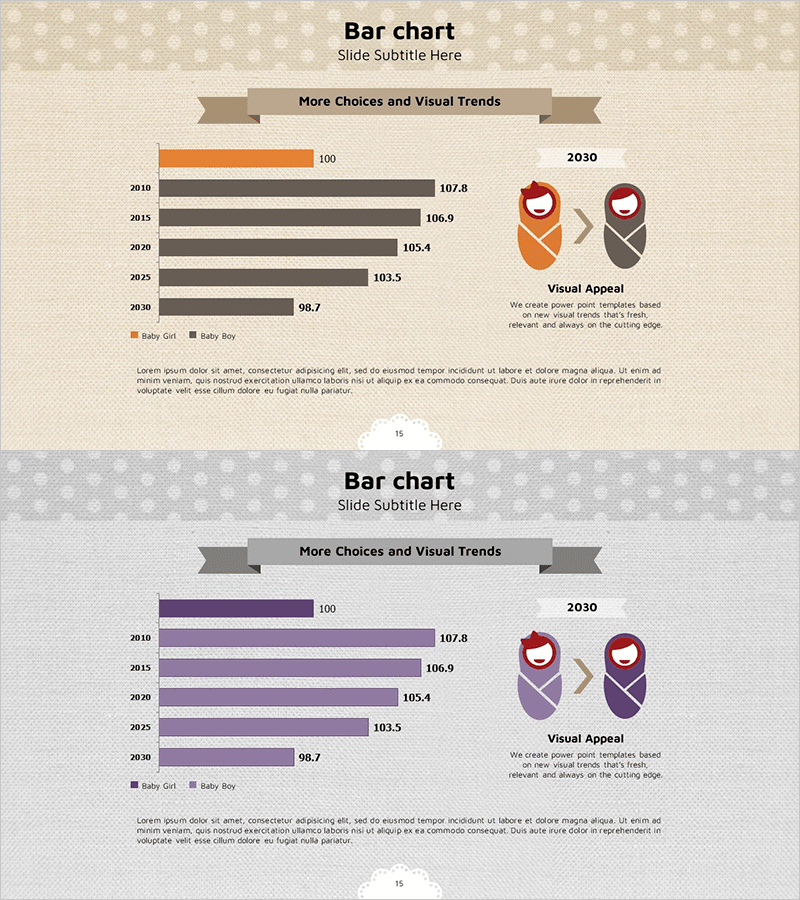
A horizontal bar chart PowerPoint slide comparing annual birth data across five years (2010–2030) with dual-series visualization. The chart uses orange and gray bars to represent gender-based data simultaneously, with numerical values (100–107.8) displayed at the end of each bar for precise comparison. Ideal for demographic reports, market trend analysis, population forecasting, and statistical presentations. The 2-slide set includes both beige-tone and gray-tone background options for flexible document integration.
Usage Points
-
Main Usage
Visualize annual birth rate trends clearly to support demographic analysis, market reporting, and future forecasting. The dual-series structure enables side-by-side comparison of gender-based or category-based data, providing credible statistical evidence for policy development, business planning, and academic presentations.
-
How to Use
Input your year-by-year numerical data into the horizontal bar structure. The orange and gray color scheme can be customized to represent different categories (gender, region, segment), and numeric labels are fully editable. Select the background tone that matches your overall presentation document style.
-
Recommended For
Government statistical agencies, demographic research presentations, policy analysis reports, educational institutions teaching demography, marketing departments analyzing market size, financial institutions tracking population trends, news organizations producing data-driven journalism.
-
Slide Structure
Slide 1: Beige-tone background with 5-year horizontal bars (2010, 2015, 2020, 2025, 2030) in dual series, numeric values displayed at bar ends, two category icons in upper right. Slide 2: Identical layout with gray-tone background. Total 2 slides.
Related Products
-

Medical Services Characteristics Connection Diagram
#Market and Competitor Analysis #Graph #Market Status
-

Sales Outlook Analysis Chart – Sleek Data Visualization
#Market and Competitor Analysis #Financial Plans and Performance #Diagram
-

Horizontal Bar Chart with Highlighted Emphasis – Market and Competitive Analysis
#Market and Competitor Analysis #Graph #Future Outlook
-

Operating Profit Comparison Analysis Chart – Enhancing Market Performance
#Market and Competitor Analysis #Financial Plans and Performance #Graph
