Operating Profit Comparison Analysis Chart – Enhancing Market Performance
RM0600007_12
- Last Update 02/25/2025
- File Size 0.2MB
- # of Slides 2
- File Format PPTX
- Slide Ratio 16:9
- Color
Keywords
- #Content-Based Slides
- #Design-Based Slides
- #Market and Competitor Analysis
- #Financial Plans and Performance
- #Graph
- #Future Outlook
- #Sales and Revenue
- #Horizontal Bar
- #Horizontal Bar Chart
- #16:9
- #horizontal bar chart PowerPoint
- #operating profit comparison slide
- #financial data visualization template
- #profit analysis chart download
- #year-over-year comparison PPT
About the Product
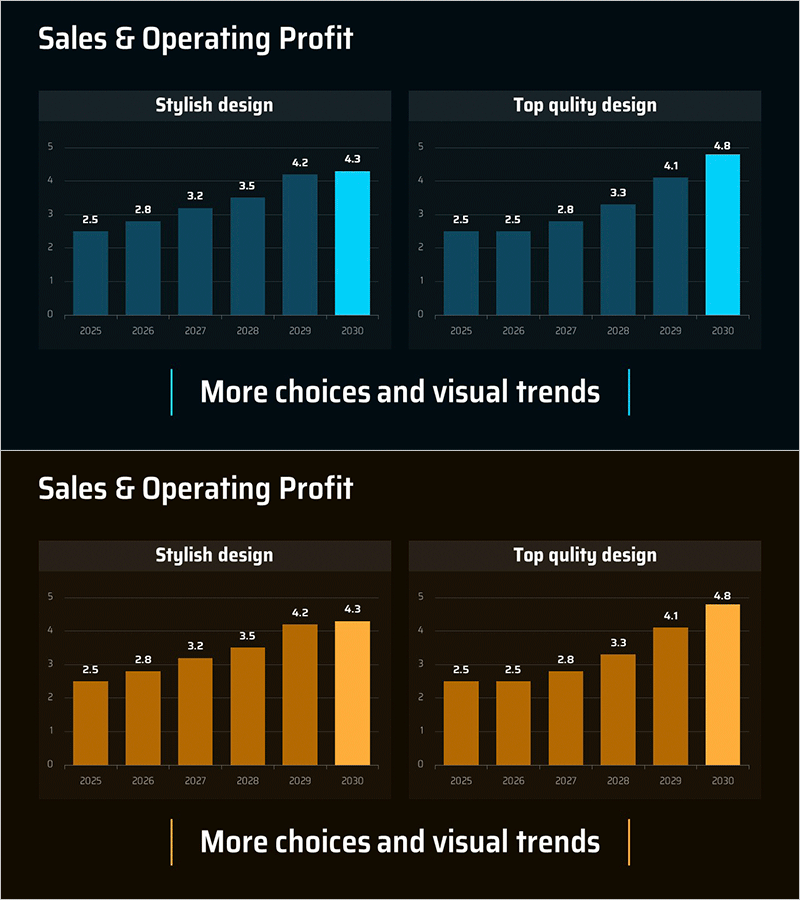
A horizontal bar chart PowerPoint slide comparing operating profit trends across two design versions over a 6-year period from 2025 to 2030. The slide features a dark blue background with cyan accent colors, presenting both 'Stylish design' and 'Top quality design' layouts side by side. Each version displays six years of financial data with clearly labeled bar heights, enabling direct comparison of profit growth trajectories. This presentation slide effectively communicates operating profit performance in financial reports, business performance presentations, and market analysis materials.
Usage Points
-
Main Usage
Clearly compare year-over-year operating profit growth trends and visualize financial performance through quantitative data representation to stakeholders. Two design versions allow selection based on presentation context and audience expectations.
-
How to Use
Apply in financial report performance analysis sections, quarterly or annual business performance presentations, investor relations meetings, and executive briefing materials. Modify data labels with actual figures and adjust color themes to match corporate branding guidelines.
-
Recommended For
CFOs, financial managers, business analysts, investor relations professionals, and management consultants presenting quantitative operating profit performance. Ideal for financial presentations requiring year-over-year profit comparison and growth rate analysis.
-
Slide Structure
2-slide deck. Each slide presents two design versions (Stylish and Top quality) side by side. Each version contains 2 sections (left and right) with 6 horizontal bars representing years 2025–2030. Data labels displayed above bars; dark blue background with cyan accent color applied throughout.
Related Products
-

Sales Outlook Comparison Analysis Chart – Market Analysis and Performance
#Market and Competitor Analysis #Financial Plans and Performance #Diagram
-

Sales Outlook Table & Bar Chart – Market and Financial Insights
#Market and Competitor Analysis #Financial Plans and Performance #Diagram
-

Sales Outlook Analysis Chart – Sleek Data Visualization
#Market and Competitor Analysis #Financial Plans and Performance #Diagram
-

Horizontal Bar Chart with Highlighted Emphasis – Market and Competitive Analysis
#Market and Competitor Analysis #Graph #Future Outlook
