Blood Donation Market Analysis Table – Market Status and Opportunities
RJ0400029_7
- Last Update 05/25/2025
- File Size 0.3MB
- # of Slides 2
- File Format PPTX
- Slide Ratio 16:9
- Color
Keywords
About the Product
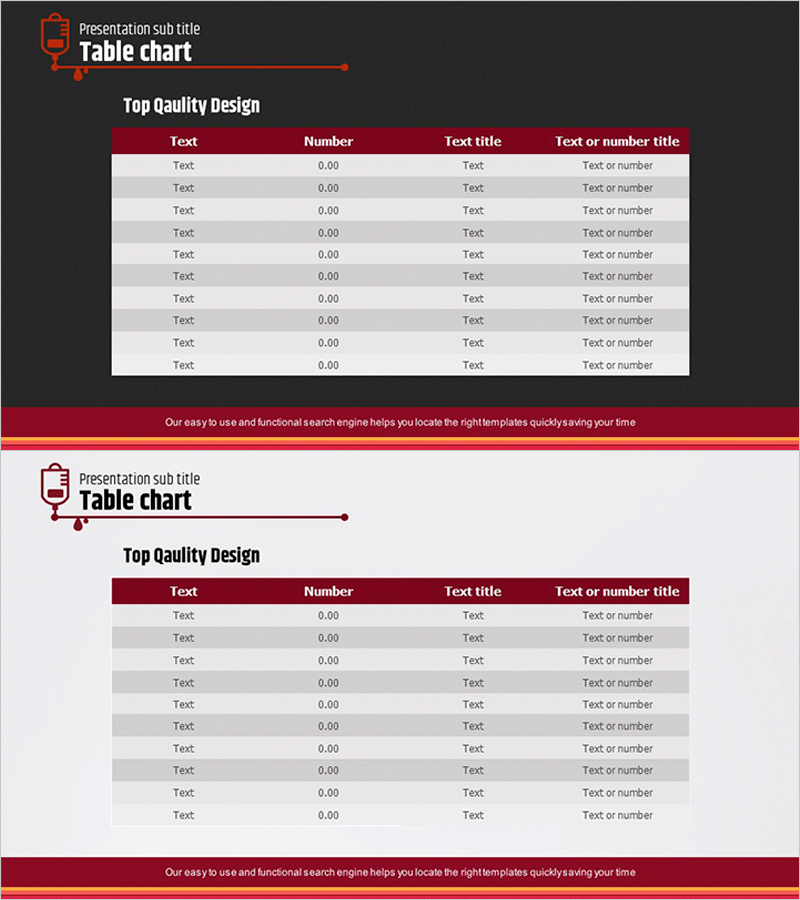
A data table PowerPoint slide with 4 columns and 10 rows designed for presenting quantitative information. Features a dark burgundy header row and alternating white and light gray background rows to enhance readability and visual hierarchy. The structure accommodates both text and numerical data simultaneously, making it ideal for market analysis, competitive comparison, and product specification presentations. Provided as a 2-slide set for immediate use in various business presentations.
Usage Points
-
Main Usage
Presents quantitative data and textual information in a systematic, organized format for easy comparison. Effectively visualizes market analysis status, competitive benchmarking, product specifications, performance metrics, and other business intelligence to enhance audience comprehension.
-
How to Use
Insert this slide into the analysis or comparison section of your presentation. Simply replace the header labels and row data with your actual information while maintaining the existing template styling. Colors and fonts can be retained or customized to match your presentation theme.
-
Recommended For
Ideal for executives, marketing teams, strategy planners, sales professionals, consultants, and data analysts. Suitable for business plans, market analysis reports, proposals, investor pitch decks, performance reports, and any presentation requiring data-driven comparison and analysis.
-
Slide Structure
2-slide set with each slide containing 4 columns (Text, Number, Text title, Text or number title) and 10 data rows. Dark burgundy header row with alternating white and light gray row backgrounds ensures clear row differentiation and minimizes visual fatigue when reading large datasets.
Related Products
-

Shareholder Status Detailed Analysis Pie Chart & Table – Impactful Data Visualization
#Company Introduction #Market and Competitor Analysis #Diagram
-

Asia Map and Table Chart – Market Analysis and Marketing Strategies
#Market and Competitor Analysis #Marketing Plan and Strategy #Diagram
-

Market Analysis Report Visualized with Pie Chart
#Market and Competitor Analysis #Diagram #Graph
-

Neuroscience Topic Analysis and Pie Charts – Market Share Visualization
#Market and Competitor Analysis #Diagram #Graph
