Market Analysis Table Chart – Practical Data Visualization
RJ0700016_18
- Last Update 07/26/2025
- File Size 1.1MB
- # of Slides 2
- File Format PPTX
- Slide Ratio 16:9
- Color
Keywords
- #Content-Based Slides
- #Design-Based Slides
- #Market and Competitor Analysis
- #Diagram
- #Market Analysis
- #Table
- #Standard Table
- #16:9
- #table chart PowerPoint
- #data comparison slide template
- #horizontal table template
- #market analysis presentation
- #tabular data visualization
- #comparison table slide download
About the Product
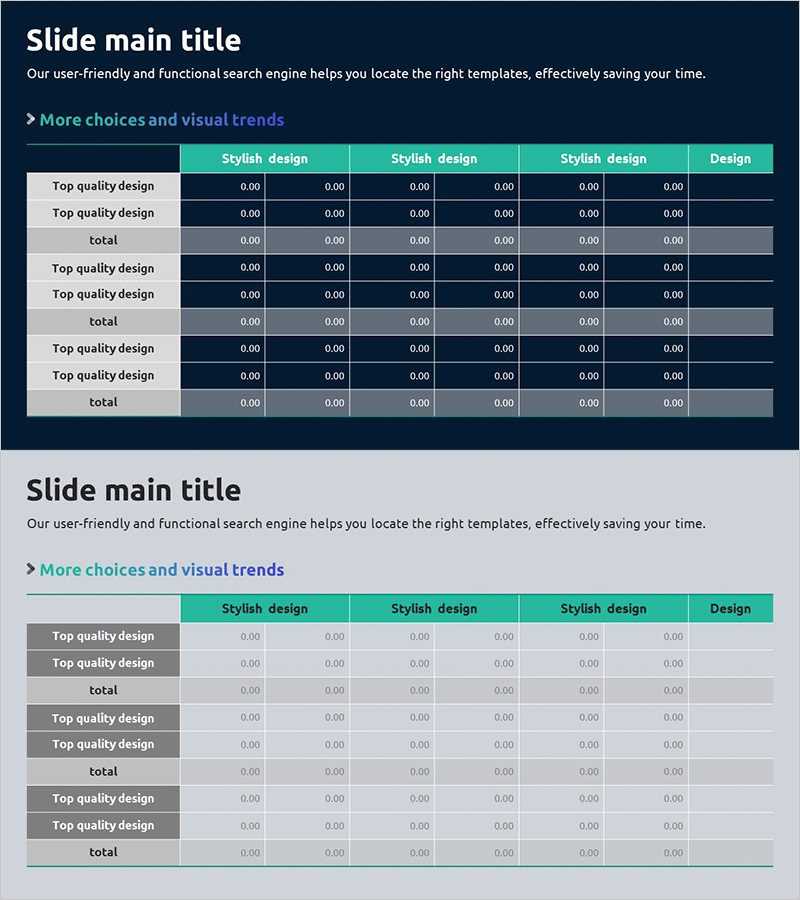
A PowerPoint slide template featuring a structured table layout for market analysis, competitive benchmarking, product performance evaluation, and multi-criteria comparisons. The design combines a dark navy background with turquoise headers and gray data rows, ensuring clear data readability and professional presentation. With 6 columns and multiple rows across 2 slides, this template is optimized for numerical comparisons and item-by-item analysis. Perfect for business reports, strategic presentations, and data-driven decision-making scenarios where organized information display is essential.
Usage Points
-
Main Usage
Organize quantitative data and categorical information in a matrix structure to facilitate comparative analysis. Suitable for market research presentations, competitive benchmarking reports, product specification comparisons, performance evaluations, and data-driven business discussions.
-
How to Use
Customize header row labels and left-column categories to match your data. Enter numerical values, percentages, or ratings into each cell. Apply color emphasis to highlight key findings. Duplicate the 2-slide layout to display multiple tables in sequence.
-
Recommended For
Marketing professionals presenting market research, sales teams conducting competitive analysis, product development teams comparing specifications, executives reviewing performance metrics, consultants preparing data-driven proposals, and business analysts presenting benchmark studies.
-
Slide Structure
Dark navy background with turquoise header row (6 columns) and gray data rows (multiple rows). Each cell provides centered text input area with clear row dividers for visual separation. Both slides maintain identical structure for consistent template reuse.
Related Products
-

Pentagon Diagram & Table Chart – Market Analysis and Competitive Insight
#Market and Competitor Analysis #Diagram #Market Analysis
-

Market Analysis Report Visualized with Pie Chart
#Market and Competitor Analysis #Diagram #Graph
-

Asia Map and Table Chart – Market Analysis and Marketing Strategies
#Market and Competitor Analysis #Marketing Plan and Strategy #Diagram
-

Market Trend Analysis Charts & Tables – The Power of Data Visualization
#Market and Competitor Analysis #Diagram #Graph
