Water Drop Shape Competitive Analysis Line Graph
RJ0400029_17
- Last Update 05/25/2025
- File Size 0.3MB
- # of Slides 2
- File Format PPTX
- Slide Ratio 16:9
- Color
Keywords
About the Product
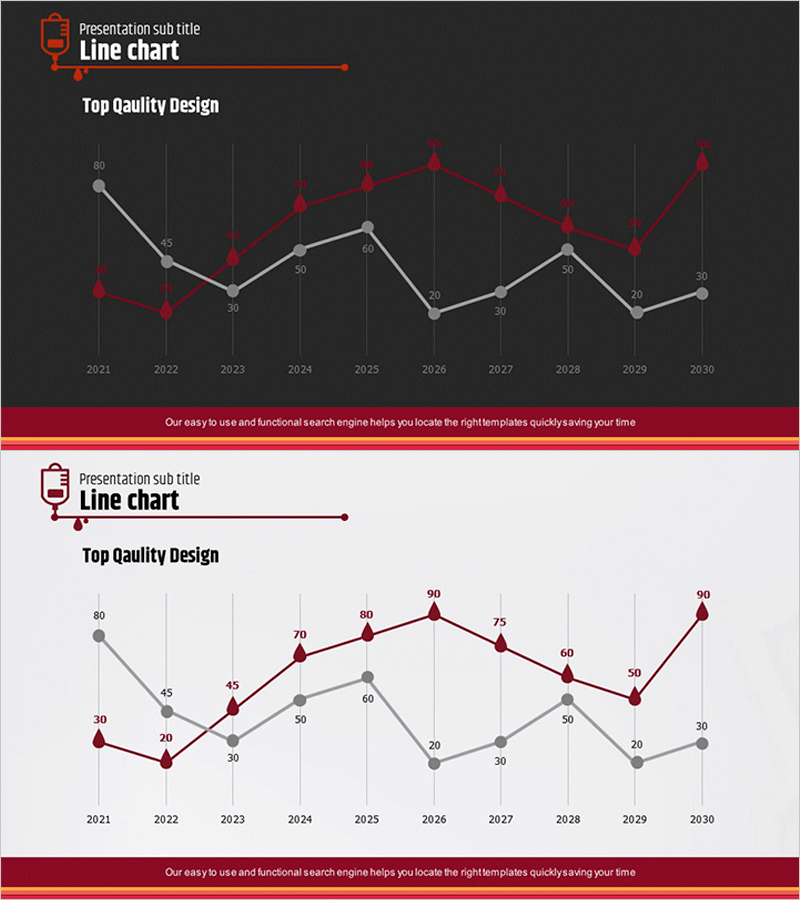
A dual-series line chart PowerPoint slide optimized for competitive analysis and market performance comparison. Displayed on a dark gray background with red and gray data series, this slide clearly visualizes trend changes over time. The chart represents 10 years of data from 2021 to 2030, with numeric labels at each data point for precise value comparison. This presentation template is ready to use in executive reports, business proposals, and marketing strategy documents, particularly in competitive landscape and market analysis sections.
Usage Points
-
Main Usage
Compare competitor performance against your own metrics using two distinct data series, revealing relative market position and trend trajectories at a glance. Effectively communicate numerical changes in growth rates, market share, satisfaction scores, or other KPIs over time.
-
How to Use
Insert this slide into executive reports, marketing strategy documents, or business proposals within the market analysis or competitive positioning section. Simply copy your Excel data into the PowerPoint chart and replace values; all elements including series colors, label positions, and axis ranges are fully editable.
-
Recommended For
Marketing managers, strategy planners, executives, consultants, and business analysts presenting competitive benchmarking, performance comparisons, or market trend analysis. Ideal for investor presentations, quarterly business reviews, and new business initiative pitches where data credibility is essential.
-
Slide Structure
Two-slide set: dark gray background slide with red and gray dual series (10 data points, vertical gridlines, Y-axis 0–80 range), plus light gray background variant with identical structure. 16:9 widescreen format, PPTX file with all elements fully editable.
Related Products
-

Competitor Analysis Broken Line Graph
#Market and Competitor Analysis #Graph #Competitor Analysis
-

VR Business Market Analysis Broken Line Graph – Competitive Advantage and Trend Analysis
#Market and Competitor Analysis #Graph #Competitor Analysis
-

Visualizing Menu Sales Status with Line Chart
#Market and Competitor Analysis #Graph #Competitor Analysis
-

Curve Chart of Architectural Topics
#Market and Competitor Analysis #Graph #Competitor Analysis
