World Travel Template Horizontal Bar Segment Chart
RJ0600080_10
- Last Update 07/11/2025
- File Size 0.2MB
- # of Slides 2
- File Format PPTX
- Slide Ratio 16:9
- Color
Keywords
- #Content-Based Slides
- #Design-Based Slides
- #Market and Competitor Analysis
- #Graph
- #Industry Trends
- #Horizontal Bar
- #Segmented Horizontal Bar
- #16:9
- #100% stacked bar chart
- #stacked horizontal bar graph PowerPoint
- #time series comparison chart
- #proportion visualization slide
- #5-year trend analysis template
About the Product
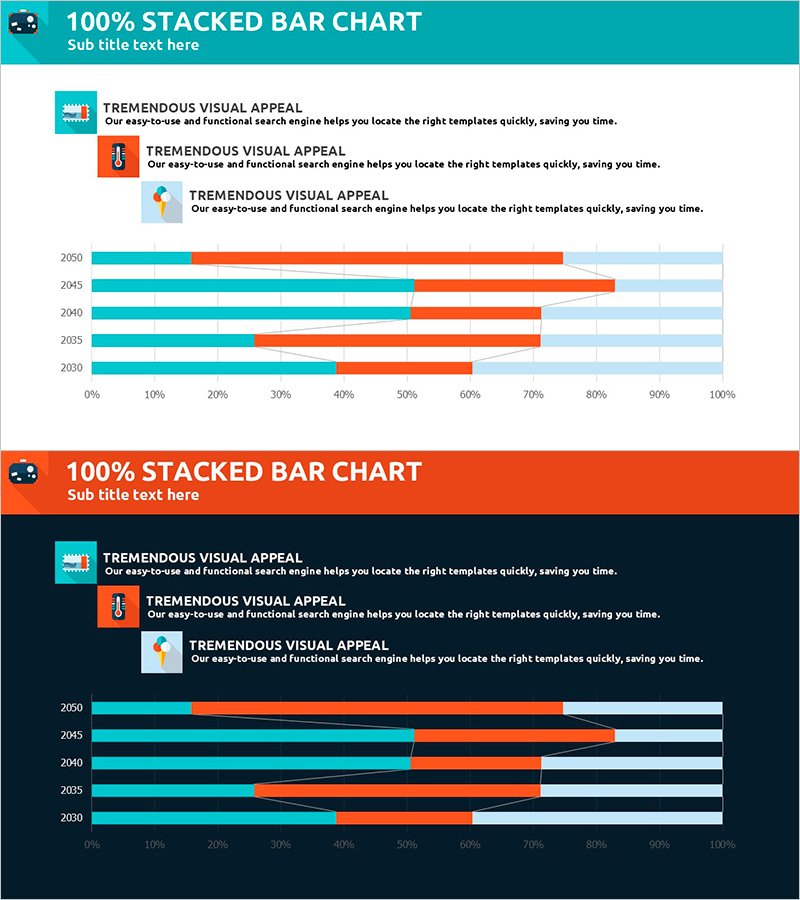
A 100% stacked horizontal bar chart PowerPoint slide that displays data across 5 years (2030–2050) segmented into 3 data series using teal, orange, and light blue colors. This presentation template visualizes proportional changes and composition ratios over time, making it ideal for market analysis, sales trends, and customer segment distribution. The chart uses a 0%–100% horizontal axis to clearly show relative shifts in each category year-over-year. Provided in 16:9 widescreen PPTX format with fully editable elements, including icons and descriptive text labels for enhanced readability and professional presentation impact.
Usage Points
-
Main Usage
This chart excels at displaying both the proportional composition and year-over-year changes in data distribution. It is optimized for business presentations requiring time-series comparison, such as market analysis, sales performance, and customer demographics, enabling clear visualization of relative magnitude shifts across categories to support strategic decision-making.
-
How to Use
The template is structured with 5 rows representing years (2030–2050) and 3 columns for data series. Each bar is normalized to a 0%–100% scale, so you can input your actual data as percentages and the chart will automatically update. Colors, axis labels, legends, and text annotations are fully customizable to match your presentation theme.
-
Recommended For
Ideal for marketing strategy presentations, business reports, market analysis documents, financial reviews, and strategic planning meetings. Particularly effective when explaining sales channel distribution shifts, customer demographic trends, product category revenue proportions, and market share evolution. Suitable for executive presentations, investor pitches, and client deliverables.
-
Slide Structure
2-slide template featuring a teal header slide with title, subtitle, and 3 icon descriptions, followed by a dark-background variant with identical chart structure. Each slide contains 5 stacked horizontal bars (one per year from 2030–2050) with 3 color-coded segments (teal, orange, light blue), gridlines at 0%, 25%, 50%, 75%, and 100% intervals, and full editing capability for data and labels.
Related Products
-

Bar Chart for Eco-friendly Practices Trends Visualization
#Market and Competitor Analysis #Graph #Industry Trends
-

Stacked Bar Graph for Growing Market Trends – Business Strategy
#Business Strategy #Market and Competitor Analysis #Graph
-

Work and Home Life Graph – Market Trends and Design Sensibility
#Market and Competitor Analysis #Graph #Industry Trends
-

Eco-friendly Business Market Share Segmentation Horizontal Bar Chart
#Market and Competitor Analysis #Graph #Industry Trends
