Medical Illustration Customer Analysis Silhouette Graph – Visualizing Customer Psychology
RJ0400023_14
- Last Update 05/24/2025
- File Size 4.6MB
- # of Slides 2
- File Format PPTX
- Slide Ratio 16:9
- Color
Keywords
About the Product
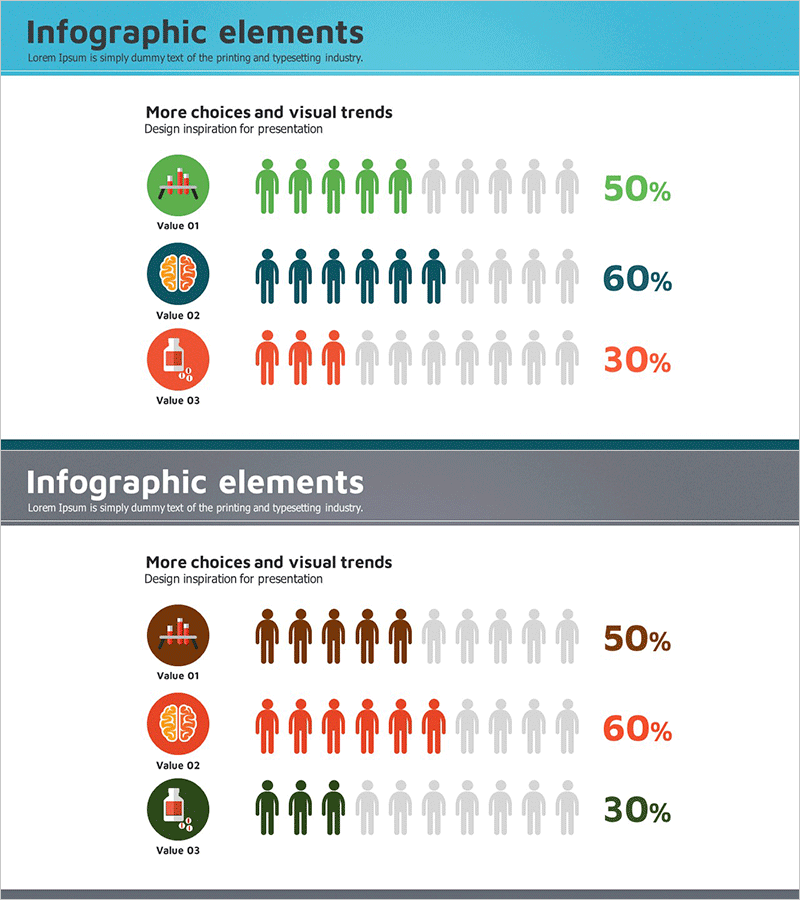
An infographic PowerPoint slide that visualizes customer psychology and preferences through silhouette icons and percentage data. Optimized for healthcare and medical industries with a professional color palette (teal, gray, orange, brown) and human silhouette figures representing customer segments. Each slide displays three value items with 10-person silhouette icons showing proportional distribution and percentage figures aligned to the right. The 2-slide set features a clean, balanced layout suitable for immediate use in customer analysis presentations. All elements are fully editable, allowing customization to match your corporate brand colors and data requirements.
Usage Points
-
Main Usage
Presents customer analysis data intuitively to support strategic decision-making. The combination of silhouette icons and percentage figures enables quick comprehension of customer segment distribution, preferences, and behavioral insights, making it ideal for executive presentations, investor pitches, and marketing strategy reviews.
-
How to Use
Insert into business plans, marketing strategy documents, or customer analysis reports for healthcare and medical organizations. Replace the sample icons, colors, and percentages with your actual data for immediate deployment. The template supports multiple customer segment comparisons and can be reused across different analysis sections.
-
Recommended For
Recommended for healthcare executives, marketing managers, and business development teams presenting customer analysis findings. Ideal for investor relations presentations, new business planning reports, and customer segmentation strategy discussions requiring data-driven decision support.
-
Slide Structure
Each slide contains a header section (title and description) followed by three value item areas. The layout features circular icons on the left (medical, brain, pharmaceutical symbols), 10-person silhouette figures in the center (colored and gray mixed), and percentage values on the right, creating a balanced left-to-right visual flow.
Related Products
-

Customer Analysis Area Chart – Data Visualization for Market Understanding
#Market and Competitor Analysis #Graph #Other
-

Gender Ratio Customer Analysis 3D Circle Graph – Insights for Market Understanding
#Market and Competitor Analysis #Graph #Other
-

Camera Pie Chart – Market Share Analysis
#Market and Competitor Analysis #Graph #Other
-

Child Silhouette and Figures – Visualizing Customer Insights
#Product/Service Introduction #Market and Competitor Analysis #Graph
