Silhouette Step Diagram – Effective Tool for Market Analysis
RJ0300096_22
- Last Update 05/16/2025
- File Size 0.3MB
- # of Slides 2
- File Format PPTX
- Slide Ratio 16:9
- Color
Keywords
About the Product
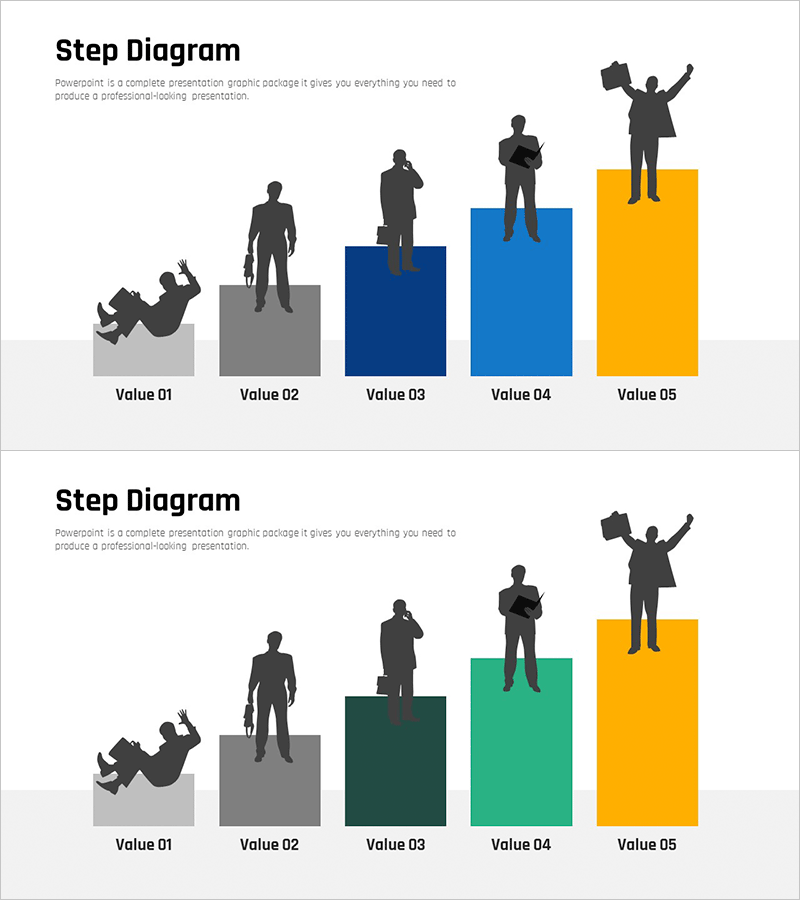
A silhouette step diagram PowerPoint slide that visualizes a 5-stage growth process with ascending human figures. Presented in three color combinations—gray, blue, and yellow—each stage features rising silhouettes to intuitively represent progress and advancement. Ideal for explaining market analysis, competitive analysis, and customer acquisition strategies. The slide includes clear text input areas for adding descriptions at each stage, making it suitable for both presentations and business reports. The layout effectively communicates sequential progression and milestone achievements.
Usage Points
-
Main Usage
Visualizes sequential growth processes, market entry stages, competitive positioning strategies, and customer acquisition phases across five distinct steps. The ascending silhouettes intuitively convey progress and achievement levels, enabling audiences to quickly grasp the progression narrative and strategic milestones.
-
How to Use
Enter stage descriptions, metrics, or outcomes in the 'Value 01–05' text areas beneath each step. Add your analysis topic in the title and description section at the top left, and maintain the color scheme to create a cohesive presentation. Customize text to match your specific business context.
-
Recommended For
Recommended for business strategy presentations, market entry planning, competitive analysis reports, customer acquisition strategy discussions, and organizational growth roadmap presentations. Ideal for executives, marketing teams, and strategic planning departments seeking to support decision-making with visual progression narratives.
-
Slide Structure
Comprises one title and description text area plus a 5-stage step diagram. Each stage consists of an ascending rectangular block with a rising silhouette figure, with clearly defined input areas for each step. Available in two color combinations: blue-gray-yellow and gray-dark green-light green-yellow schemes.
Related Products
-

Gender Ratio Customer Analysis 3D Circle Graph – Insights for Market Understanding
#Market and Competitor Analysis #Graph #Other
-

Orange Hexagon Presentation Template Segmented Vertical Bar Graph – Market and Competitive Analysis
#Market and Competitor Analysis #Graph #Other
-

Comparative Chart of Male and Female Professionals
#Market and Competitor Analysis #Graph #Other
-

User Analysis Donut Chart – Optimal for Market and Competitor Analysis
#Market and Competitor Analysis #Graph #Other
