Hospital Illustration with Table – Clear Data Presentation
RJ0400023_10
- Last Update 05/23/2025
- File Size 4.6MB
- # of Slides 2
- File Format PPTX
- Slide Ratio 16:9
- Color
Keywords
About the Product
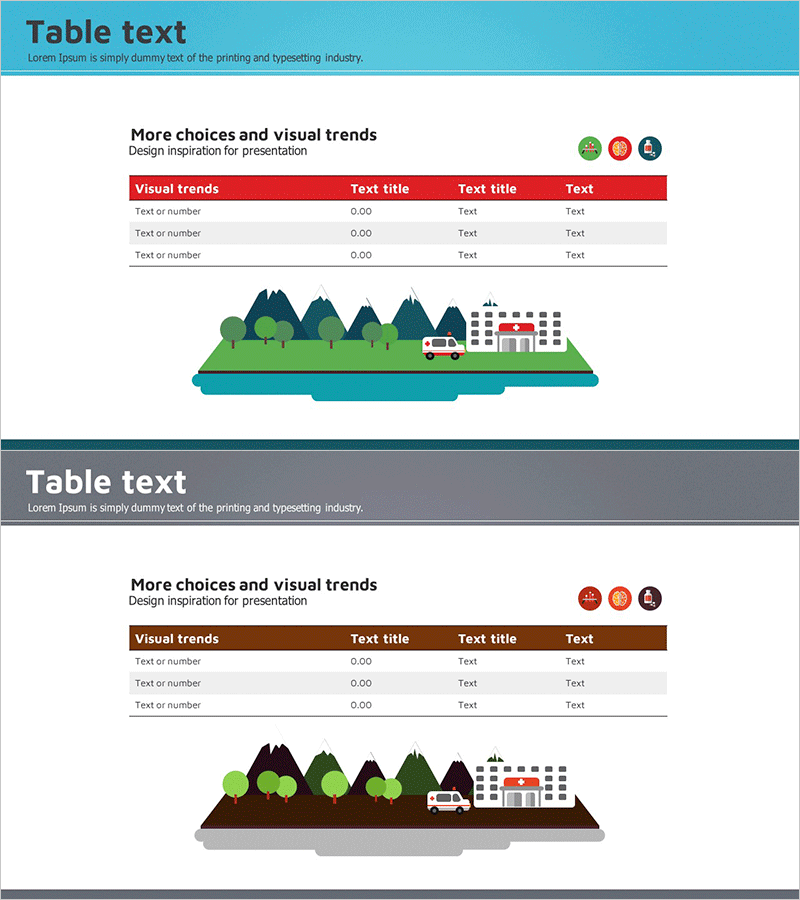
A PowerPoint slide combining hospital and healthcare illustrations with a 4-column data table for clear information presentation. Two color variations are provided: teal header and gray background versions. Each slide displays 3 rows of data items in a structured layout, ideal for presenting medical statistics, hospital performance metrics, and healthcare market analysis. Delivered in 16:9 widescreen PPTX format, fully editable and ready for medical presentations, hospital reports, and healthcare marketing pitches.
Usage Points
-
Main Usage
Presents quantitative healthcare data—patient statistics, hospital operations, medical service performance—in a structured table format alongside hospital imagery. The teal header reinforces healthcare and medical credibility, while the illustration adds visual context and professional appeal to data-driven presentations.
-
How to Use
The hospital building, medical staff, and ambulance illustration at the top remains fixed. Replace the table headers ('Visual trends,' 'Text title,' 'Text title,' 'Text') with your column names, then input numerical data and text in the three data rows. Choose between teal or gray color variants based on your presentation theme.
-
Recommended For
Hospital administrators, healthcare marketing professionals, medical consultants, public health officials, and medical data analysts presenting patient satisfaction metrics, clinical outcomes, service performance, and operational reports to stakeholders.
-
Slide Structure
2-slide set. Each slide features hospital and medical staff illustrations (approximately 40% of slide height) at the top, with a 4-column × 3-row data table (approximately 50% height) below. Table headers are highlighted in red (teal variant) or brown (gray variant), while data rows use white background with black text for optimal readability.
Related Products
-

Observation Status Analysis Graph – Market and Competitor Analysis
#Market and Competitor Analysis #Diagram #Graph
-

Market Trend Analysis Charts & Tables – The Power of Data Visualization
#Market and Competitor Analysis #Diagram #Graph
-

Performance Analysis Pie Chart – Market Share Visualization
#Market and Competitor Analysis #Diagram #Graph
-

Marketing Performance Analysis Chart by Year – Visualizing Market Trends
#Market and Competitor Analysis #Diagram #Graph
