Product Service After Service and Maintenance Plan – Flow Diagram for Operational Efficiency
RJ0400021_23
- Last Update 05/23/2025
- File Size 2.1MB
- # of Slides 2
- File Format PPTX
- Slide Ratio 16:9
- Color
Keywords
- #Content-Based Slides
- #Design-Based Slides
- #Operational Plan
- #Diagram
- #Risk Management
- #Post-Implementation Management & Maintenance
- #Flow
- #Circular Flow
- #16:9
- #circular diagram PowerPoint
- #2-stage flow diagram template
- #bidirectional cycle slide
- #operational planning diagram
- #maintenance process PowerPoint slide
About the Product
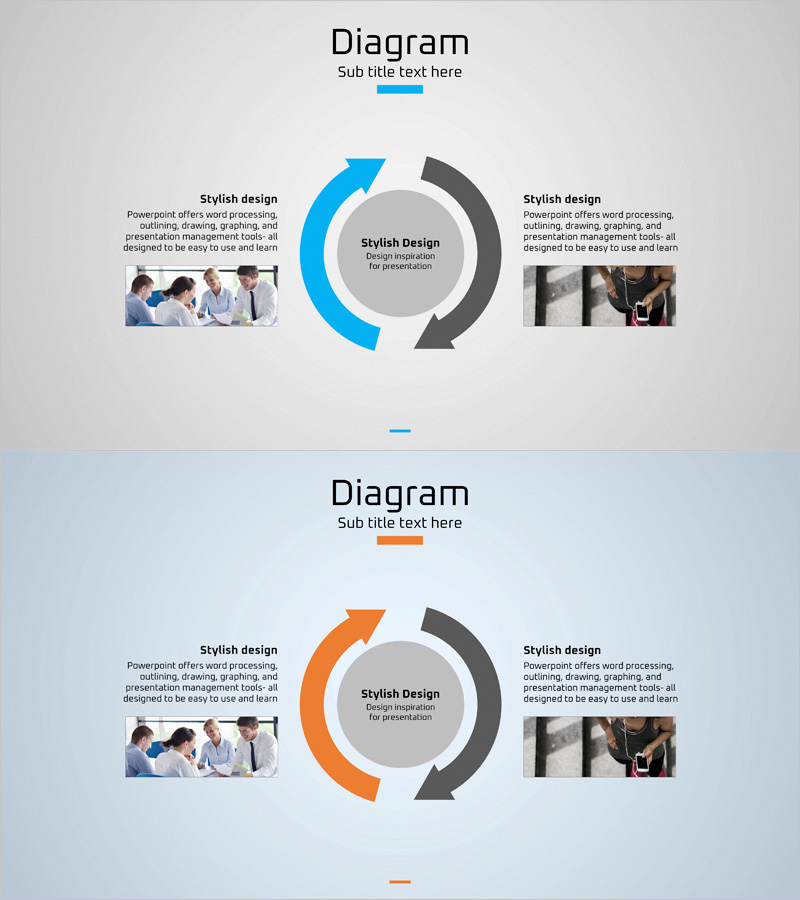
A 2-slide circular diagram PowerPoint template visualizing product service after-sales management and maintenance planning. The design features blue and gray arrows flowing bidirectionally around a central circle, representing operational efficiency and continuous improvement cycles. Each stage includes dedicated text and image insertion areas for seamless customization. Ideal for operational planning, risk management, and process flow presentations. Provided in 16:9 widescreen PPTX format with fully editable colors, arrow directions, and layout elements.
Usage Points
-
Main Usage
Clearly communicates product service after-sales management, maintenance planning, and operational efficiency improvement cycles through a 2-stage circular structure. The central hub and bidirectional arrows effectively visualize continuous improvement and feedback loops, making it ideal for board reports, operational strategy presentations, and quality management briefings.
-
How to Use
Insert your core concept (e.g., Operational Efficiency) in the central circle. Add after-sales management details to the left arrow stage and maintenance items to the right arrow stage. Supplement each stage with descriptive text and images in the adjacent text boxes. Customize colors and arrow thickness to match your corporate branding guidelines.
-
Recommended For
Operations managers, quality assurance specialists, project managers, and technical support teams explaining after-sales management and maintenance processes. Widely used in manufacturing, IT services, construction, and real estate management industries for strategic presentations and internal training materials.
-
Slide Structure
2-slide set. Slide 1: Blue arrow (left) and gray arrow (right) flowing bidirectionally around a central circle. Two text boxes and image insertion areas positioned beside each arrow. Slide 2: Identical structure with orange arrow variation. All text and images are fully editable in 16:9 widescreen PPTX format.
Related Products
-

Interactive Gear Flow Presentation Template – Simplifying Complex Business Strategies
#Operational Plan #Diagram #Business Processes
-

Tri-Point Analysis in 3D Frames – Operational Planning and Risk Management
#Operational Plan #Technical Approach #Diagram
-

Camping Product Quality Assurance Plan Slide
#Operational Plan #Diagram #Business Processes
-

Sailing Travel Business Vision Diagram – Capturing Future Vision
#Operational Plan #Technical Approach #Diagram
