Arrow Cycle Diagram – Visualization of Operational Plans
RJ0600028_12
- Last Update 06/27/2025
- File Size 4MB
- # of Slides 2
- File Format PPTX
- Slide Ratio 16:9
- Color
Keywords
About the Product
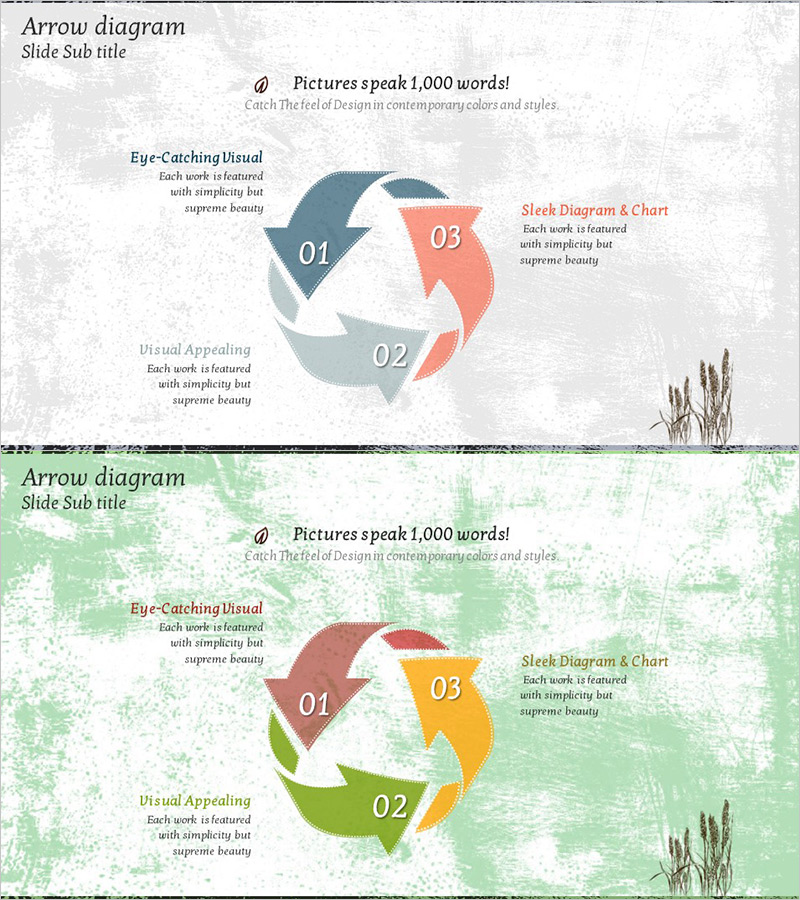
A 3-step circular arrow diagram PowerPoint slide designed to visualize operational plans and process flows. Gray and coral-colored arrows connect in a clockwise cycle, clearly representing the cyclical structure. Each stage includes dedicated text description areas for explaining operational procedures, risk management processes, continuous improvement cycles, and more. Delivered in a 2-slide 16:9 widescreen format, with fully editable colors and text for immediate use in diverse business presentations.
Usage Points
-
Main Usage
Optimized for visually explaining cyclical business concepts such as operational plans, process flows, risk management, and continuous improvement. The 3-step arrow structure clearly represents sequential progression and feedback loops.
-
How to Use
Use as a process explanation slide in the strategy, operations, or management sections of presentations. Fill in the text boxes with specific activities, responsible parties, and timelines to enhance team communication and understanding. Customize colors to match different topics and branding.
-
Recommended For
Ideal for executives, project managers, operations specialists, consultants, and training facilitators explaining business processes, quality management cycles, marketing campaign phases, and product development workflows. Suitable for internal reports, client proposals, and educational seminars.
-
Slide Structure
2-slide set in 16:9 widescreen format (PPTX). First slide features a clockwise circular flow (01→02→03→01) with gray, coral, and light gray arrows, each with adjacent text description areas. Second slide offers a color variation with green, coral, and wine-red tones. All elements are fully editable.
Related Products
-

Cyclical Structure for Risk Response
#Operational Plan #Diagram #Risk Management
-

Carbon Neutral Cycle Diagram Brown Blue
#Operational Plan #Diagram #Risk Management
-

ABC Strategy Depicted Through Multi-directional Arrows
#Operational Plan #Diagram #Risk Management
-

Interactive Gear Flow Presentation Template – Simplifying Complex Business Strategies
#Operational Plan #Diagram #Business Processes
