Smartwatch Product Technology and Development Status – Innovation and Advancement
RJ0400021_16
- Last Update 05/23/2025
- File Size 1.4MB
- # of Slides 2
- File Format PPTX
- Slide Ratio 16:9
- Color
Keywords
- #Content-Based Slides
- #Design-Based Slides
- #Product/Service Introduction
- #Business Introduction
- #Diagram
- #Development Status
- #Technological Status
- #Structure
- #Pyramid Chart
- #16:9
- #pyramid diagram PowerPoint
- #funnel diagram slide
- #hierarchy structure template
- #4-level diagram presentation
- #product technology development slide
- #business process visualization
About the Product
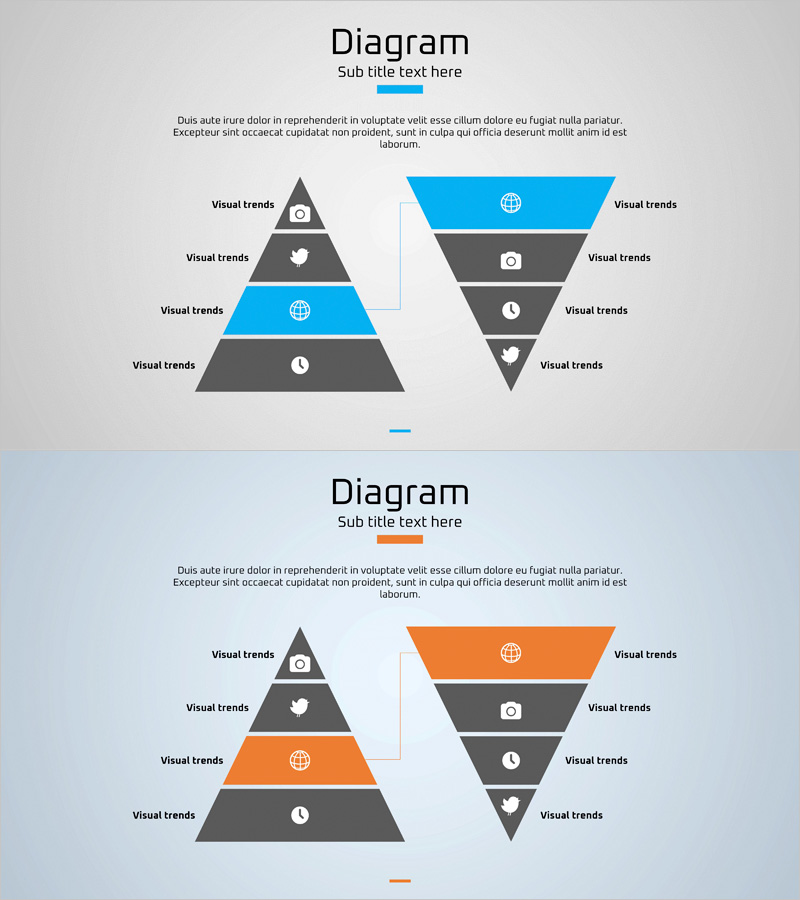
A 2-slide PowerPoint set featuring pyramid and inverted funnel hierarchy diagrams for visualizing layered information structures. The pyramid shape represents top-down progression from broad concepts to detailed elements, while the funnel illustrates convergence from wide scope to focused outcomes. Each of the four levels includes icon placeholders and text areas, making it ideal for presenting product technology stages, development status, business implementation phases, and organizational hierarchies. The dual-color design uses blue and orange accents to distinguish key stages, optimized for 16:9 widescreen format in PPTX.
Usage Points
-
Main Usage
Designed to illustrate product development stages, business implementation processes, organizational hierarchies, and information priority levels in a structured, layered format. The pyramid conveys top-down flow from concept to detail, while the funnel demonstrates convergence from broad scope to concentrated results.
-
How to Use
Enter stage-specific content into each level's text area and customize icons to match your presentation topic. Use color accents to highlight critical stages and add detailed speaker notes for comprehensive presentation delivery.
-
Recommended For
Ideal for product development teams presenting technology status reports, executive-level business progress updates, investor pitches on growth stages, and educational seminars on learning progression. Particularly effective for IT, manufacturing, finance, and consulting sectors presenting strategy development and implementation timelines.
-
Slide Structure
Slide 1: Pyramid with 4 hierarchical levels (top to bottom: Level 1, 2, 3, 4), each containing one icon and text label. Slide 2: Inverted funnel with matching 4-level structure and identical icon-text layout. Includes blue-background and light-blue-background variations for design flexibility.
Related Products
-

Visualizing Business Development Status with Donut Chart Slide
#Product/Service Introduction #Business Introduction #Graph
-

Technology Achievement Donut Chart
#Product/Service Introduction #Business Introduction #Graph
-

Development Status by Technology Diagram Slide - Core Information
#Product/Service Introduction #Business Introduction #Diagram
-

Four Color Infographic – Business Status Presentation
#Product/Service Introduction #Business Introduction #Graph
