Competitor Analysis and Market Trends Graph – Contrast of Blue and Red
RJ0400020_17
- Last Update 05/23/2025
- File Size 0.1MB
- # of Slides 2
- File Format PPTX
- Slide Ratio 16:9
- Color
Keywords
- #Content-Based Slides
- #Design-Based Slides
- #Market and Competitor Analysis
- #Graph
- #Competitor Analysis
- #Industry Trends
- #Horizontal Bar
- #Grouped Horizontal Bar
- #16:9
- #grouped horizontal bar chart PowerPoint
- #year-over-year comparison slide template
- #competitor analysis chart
- #market trends visualization
- #multi-series bar graph template
About the Product
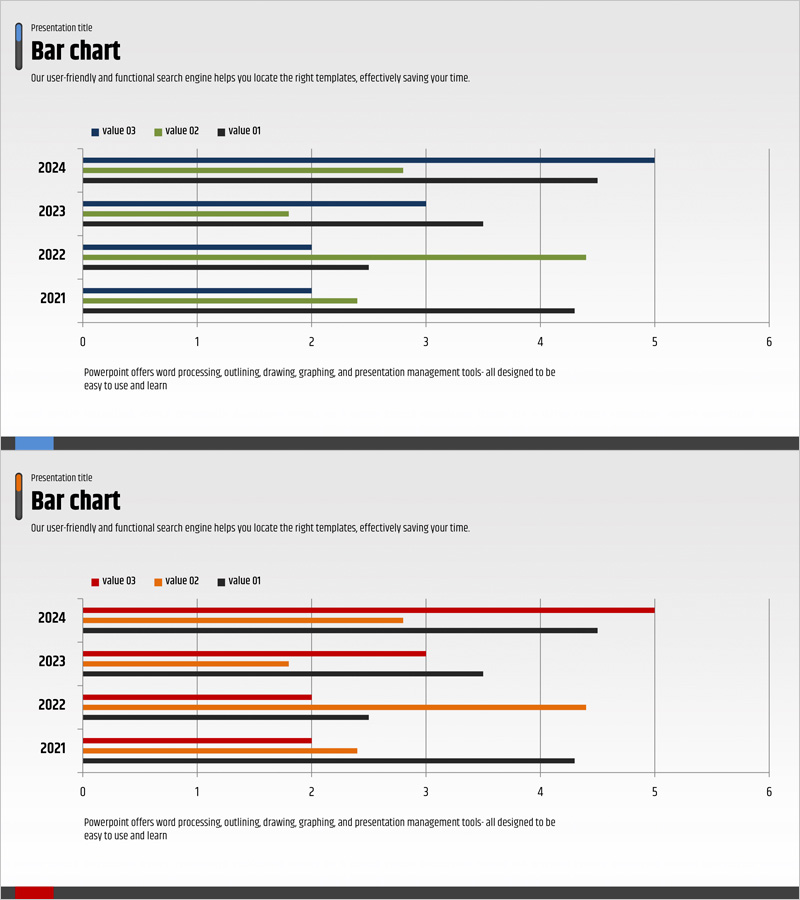
A grouped horizontal bar chart PowerPoint slide designed to visualize competitor analysis and market trends across multiple years. This presentation template displays data from 2021 to 2024 across three series (value 03, value 02, value 01) with contrasting color schemes for clear differentiation. The first slide features navy, green, and black bars, while the second slide uses burgundy, orange, and black combinations, allowing you to select the color palette that matches your presentation tone. With a horizontal axis ranging from 0 to 6 and year-based row layout, numerical comparisons are intuitive and immediately applicable to executive reports, marketing analysis, and business performance presentations.
Usage Points
-
Main Usage
Effectively compare multiple data sets such as competitor performance, market trends, sales figures, and customer satisfaction metrics across different years. The grouped structure allows simultaneous comparison of multiple series within each year, enabling viewers to identify both trend changes and inter-series differences at a glance.
-
How to Use
Deploy this slide in executive reports, quarterly performance presentations, marketing strategy meetings, and investor briefings to communicate quantitative analysis results persuasively. You can directly input data in PowerPoint and configure the chart to automatically reflect bar lengths and colors based on your dataset.
-
Recommended For
Ideal for executives, marketing managers, sales leaders, consultants, and data analysts who need to visualize quantitative comparative analysis. Particularly suited for reports comparing multiple categories such as years, quarters, regions, or product lines simultaneously.
-
Slide Structure
Two-slide set, each featuring a horizontal bar chart with years 2021–2024 on the Y-axis and a 0–6 range on the X-axis. Each year displays three series (value 03, value 02, value 01) side by side, totaling 12 bars per slide. Slide 1 uses navy, green, and black color combinations; Slide 2 uses burgundy, orange, and black for flexible presentation styling.
Related Products
-

Competitor Analysis Broken Line Graph – Market Trends and Vision
#Market and Competitor Analysis #Graph #Competitor Analysis
-

Science Market Analysis Bundled Bar Graph
#Market and Competitor Analysis #Graph #Competitor Analysis
-

Market Trend Analysis Mixed Chart – Capturing Data and Insights
#Market and Competitor Analysis #Graph #Other
-

Competitor Year-over-Year Comparison Analysis Bar Graph – Essential Tool for Market Analysis
#Market and Competitor Analysis #Graph #Competitor Analysis
