Learning Icon and Donut Chart Ratio – Effective Market and Competitor Analysis
RJ0500027_16
- Last Update 06/14/2025
- File Size 0.9MB
- # of Slides 2
- File Format PPTX
- Slide Ratio 16:9
- Color
Keywords
- #Content-Based Slides
- #Design-Based Slides
- #Business Introduction
- #Market and Competitor Analysis
- #Graph
- #Technological Status
- #Market Share
- #Circles
- #Doughnut Chart
- #16:9
- #donut chart PowerPoint
- #pie chart slide template
- #market share visualization
- #competitor analysis presentation
- #4-segment ratio chart
About the Product
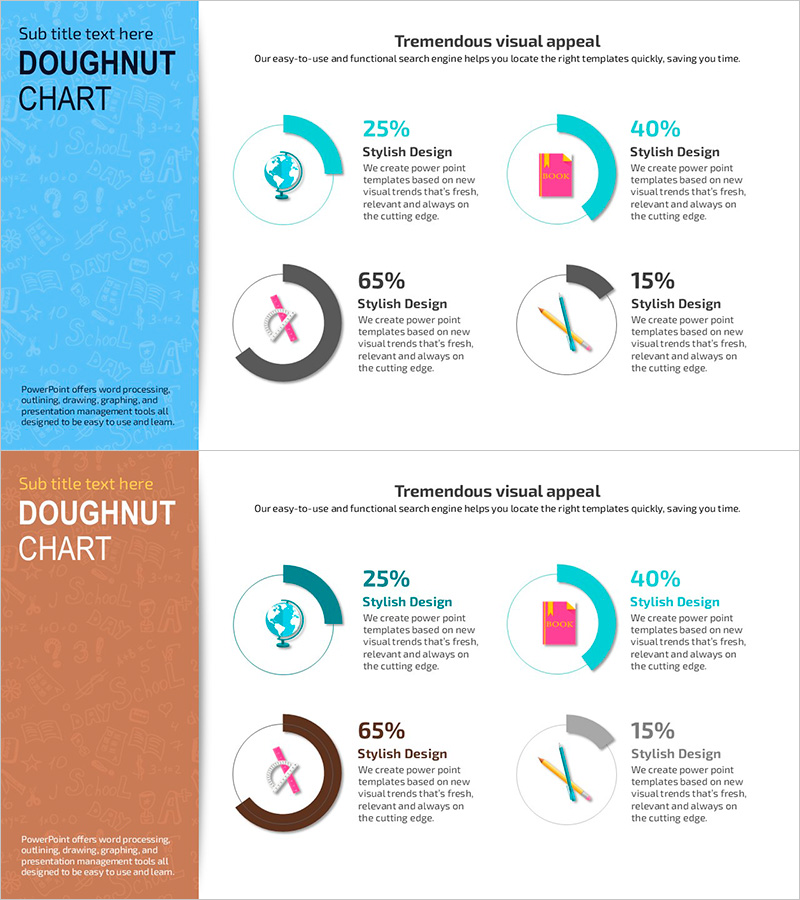
A PowerPoint slide template optimized for market analysis and competitive comparison using a donut chart design. This presentation slide combines a 4-segment donut-shaped pie chart with a learning icon to convey data meaning intuitively and professionally. The 2-slide set offers two color themes—blue and orange—each formatted in 16:9 widescreen ratio for modern presentation environments. Fully editable PPTX format allows immediate customization for corporate reports, marketing plans, business analysis documents, and strategic presentations without additional design work.
Usage Points
-
Main Usage
Visualize proportional data across four categories—market share, competitor comparison, customer composition, or sales distribution—using a clear donut chart format. The accompanying learning icon reinforces analytical credibility and professionalism, making it ideal for reports and presentations that require data-driven insights and visual impact.
-
How to Use
Open the slide and replace the donut chart segments and percentages with your actual data. Use the blue theme for technology and IT sectors, or the orange theme for marketing and sales contexts. Edit the text labels and values to reflect your analysis, and customize icon colors or add supplementary icons as needed for your specific presentation.
-
Recommended For
Marketing managers, sales analysts, executives, management consultants, and business strategists presenting market conditions and competitive positioning. Ideal for quarterly performance reports, investor pitch decks, business plans, marketing strategy presentations, and executive briefing materials.
-
Slide Structure
Each slide features a title area, 4-segment donut chart with color-coded sections, legend with percentage labels, and a learning icon for visual emphasis. A left sidebar provides space for subtitles and topic identification, while ample white space around the chart accommodates additional text, annotations, or supplementary data points.
Related Products
-

Scientific Analysis Donut Circle Graph
#Business Introduction #Market and Competitor Analysis #Graph
-

Red Purple Highlight Donut Chart - Market Share Analysis
#Business Introduction #Market and Competitor Analysis #Diagram
-

Donut Pie Chart for Medical Technology – Market Share Analysis
#Business Introduction #Market and Competitor Analysis #Graph
-

Donut Graph by Caries Erosion Status – Essential for Market Analysis
#Business Introduction #Market and Competitor Analysis #Graph
