Startup Company Market Analysis Graph – Competition and Growth
RJ0300088_16
- Last Update 05/13/2025
- File Size 2.2MB
- # of Slides 2
- File Format PPTX
- Slide Ratio 16:9
- Color
Keywords
- #Content-Based Slides
- #Design-Based Slides
- #Market and Competitor Analysis
- #Diagram
- #Graph
- #Competitor Analysis
- #Market Analysis
- #Spread
- #Column
- #Centralized Diagram
- #Grouped Column
- #16:9
- #clustered bar chart PowerPoint
- #market analysis slide template
- #4-series graph design
- #competitive analysis chart
- #business data visualization
- #startup presentation slides
About the Product
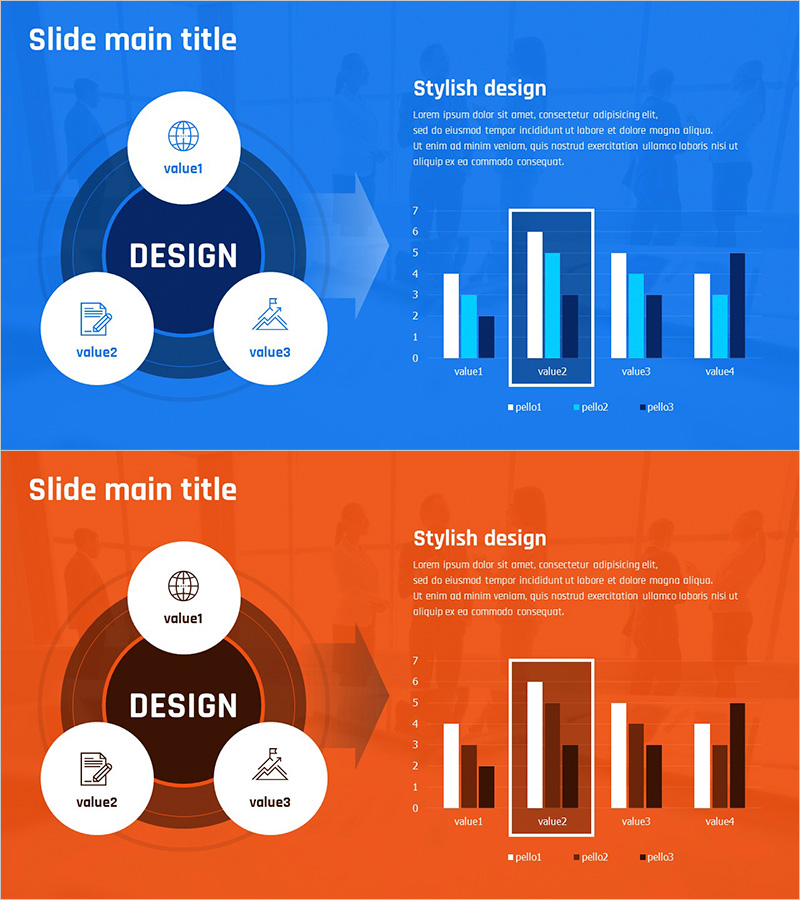
A 2-slide clustered bar chart PowerPoint template optimized for startup market analysis and competitive comparison. The first slide features a blue background with a central circular diagram (3 nodes) on the left and a 4-series clustered bar chart on the right, combining core values with quantitative data visualization. The second slide uses an orange background with identical layout for color contrast emphasis. Each slide supports 4 data points (value1–value4) and 3 color series (pallet1–pallet3), formatted for 16:9 widescreen presentation. Ideal for investor pitches, business plans, marketing reports, and data-driven decision-making documents.
Usage Points
-
Main Usage
Professional data visualization for startup and corporate market analysis, competitive benchmarking, and macro-level metrics. The central circular diagram symbolizes core values (global reach, documentation, strategy), while the 4-series clustered bar chart clearly compares 4 competitors or market indicators with quantitative precision.
-
How to Use
Deploy in investor pitch decks, business plan market analysis sections, quarterly performance reports, and marketing strategy presentations. Replace template text and values with your actual data, and adjust series colors to align with brand guidelines or corporate identity standards.
-
Recommended For
Startup founders, business development managers, marketing strategists, financial analysts, and consultants who drive data-informed decision-making. Particularly suited for organizations requiring competitive landscape analysis and growth metric tracking.
-
Slide Structure
2-slide set. Each slide combines a left-aligned central circular diagram (3 nodes with icons) and a right-aligned 4-series clustered bar chart (4 data points, 3 color series). Blue and orange backgrounds provide visual contrast; both slides are optimized for 16:9 widescreen format.
Related Products
-

Note Illustration Theme Chart – Market Analysis and Competitor Insights Tool
#Market and Competitor Analysis #Diagram #Graph
-

Competitor Comparison Analysis Bar Graph – Market Insights
#Market and Competitor Analysis #Graph #Competitor Analysis
-

Infographic Slide Highlighting Visualized Data – Modern Design
#Market and Competitor Analysis #Graph #Competitor Analysis
-

Business Competitor Comparison Analysis Graph – Effective Investment and Strategy Development
#Market and Competitor Analysis #Graph #Competitor Analysis
