Blue Gray Donut Circle Graph - Visualizing Market Share
RJ0400018_29
- Last Update 05/22/2025
- File Size 0.4MB
- # of Slides 2
- File Format PPTX
- Slide Ratio 16:9
- Color
Keywords
About the Product
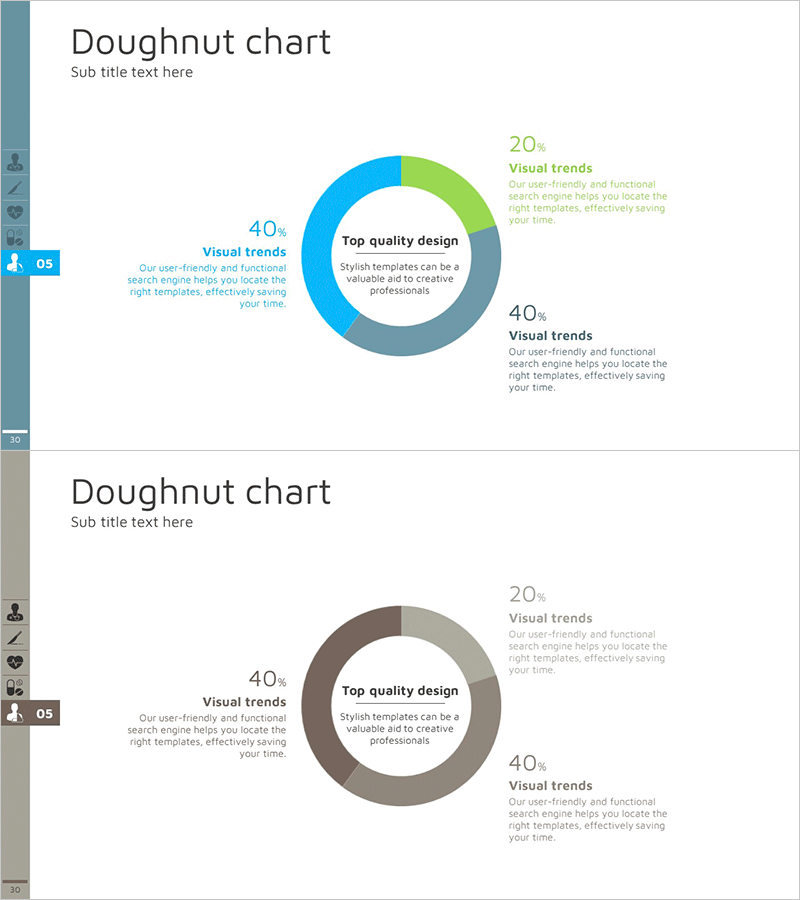
A 2-slide PowerPoint set featuring a 4-segment donut chart in blue, green, and gray tones for visualizing market share, sales ratios, customer composition, and budget allocation. Each segment displays percentage values and descriptive labels positioned around the donut ring, with a central text area for key messaging. Designed for business reports, marketing presentations, financial analysis, and strategic planning decks. Fully editable in 16:9 widescreen format with customizable colors, percentages, and labels for immediate use in professional presentations.
Usage Points
-
Main Usage
Visualize proportional data such as market share, revenue breakdown, customer segments, and resource allocation using a donut chart format. The central area highlights the main topic while outer segments display percentages and labels, making data interpretation clear and professional for executive presentations.
-
How to Use
Insert into market analysis sections of business reports, customer segmentation pages in marketing plans, revenue composition slides in financial presentations, and resource allocation charts in strategy meetings. Double-click any segment, percentage, or label to edit colors, values, and text directly within PowerPoint.
-
Recommended For
Finance managers, marketing professionals, business analysts, management consultants, data scientists, and educators presenting data-driven insights. Ideal for quarterly performance reviews, customer satisfaction surveys, market research presentations, and budget allocation discussions.
-
Slide Structure
Slide 1: 4-segment donut chart with blue, green, gray, and dark blue colors; segments showing 20-40% ranges; central text box reading 'Top quality design'; right-aligned legend with 4 labeled items. Slide 2: Donut chart in brown, beige, gray, and charcoal tones; identical 4-segment structure; centered emphasis text; left-aligned legend. Both slides in 16:9 widescreen PPTX format, fully editable.
Related Products
-

Causes of Fire Donut Chart – Visualizing Market Analysis
#Market and Competitor Analysis #Graph #Market Share
-

Doughnut Chart for Office Worker Commuting Survey Results – Market Trends Visualization
#Market and Competitor Analysis #Graph #Market Status
-

Market Share Donut Chart for Eco-Friendly Businesses – Trends and Insights
#Market and Competitor Analysis #Graph #Market Share
-

Analyzing Market Share with Donut Chart – Clean and Stylish Design
#Company Introduction #Market and Competitor Analysis #Graph
