Competitor Analysis Broken Line Graph – Effective Visualization
RJ0400018_19
- Last Update 05/22/2025
- File Size 0.3MB
- # of Slides 2
- File Format PPTX
- Slide Ratio 16:9
- Color
Keywords
About the Product
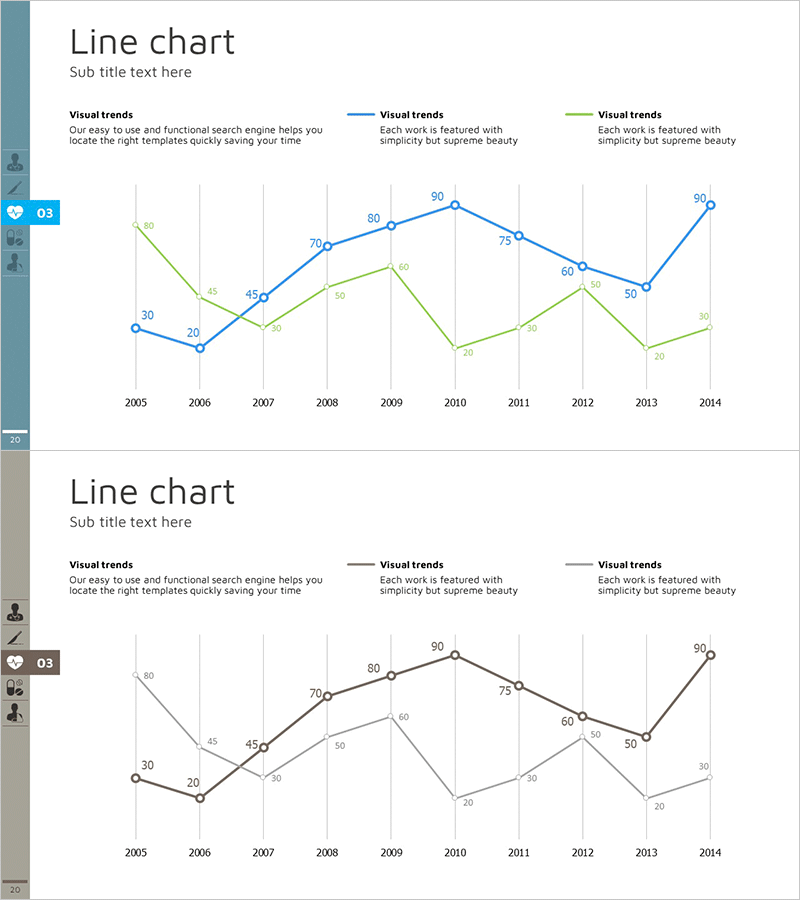
A dual-series line chart PowerPoint slide that compares data trends across a 10-year period from 2005 to 2014. The blue and green lines represent two distinct data sets, with each data point clearly labeled with numerical values for precise reference. The grid background enhances readability and makes it easy to track value changes over time. This presentation slide is ready to use for competitive analysis, market trend reports, sales performance comparisons, and any analysis requiring multi-series trend visualization.
Usage Points
-
Main Usage
Designed to compare two or more data series over time, this slide effectively displays competitive performance trends, market share evolution, sales progression, and customer satisfaction changes. The dual-line format allows viewers to quickly identify patterns, intersections, and divergence between datasets.
-
How to Use
Replace the sample data points and numerical labels with your actual data. Customize the line colors, legend text, and slide title to match your presentation topic. The grid structure and axis labels can be adjusted as needed for your specific data range.
-
Recommended For
Marketing analysts, sales managers, business consultants, financial analysts, and executives preparing competitive analysis reports, market research presentations, and performance reviews. Ideal for situations requiring simultaneous comparison of 2-3 trend lines.
-
Slide Structure
Two-slide set in 16:9 widescreen format. First slide features blue and green dual-series lines with 10 data points (2005-2014) and labeled values. Second slide presents the same chart in monochrome black-and-white version. Both include title area, legend, gridlines, and data point labels for clarity.
Related Products
-

Comparative Analysis Graph by Year – Data Visualization
#Product/Service Introduction #Market and Competitor Analysis #Graph
-

Competitor Analysis Broken Line Graph
#Market and Competitor Analysis #Graph #Competitor Analysis
-

Curve Chart of Architectural Topics
#Market and Competitor Analysis #Graph #Competitor Analysis
-

Mobile App Competitor Analysis – Visualizing Market Share
#Market and Competitor Analysis #Graph #Other
