Service Future Outlook Graph – Visualized in Blue, Orange, and Green
RJ0400017_6
- Last Update 05/22/2025
- File Size 0.2MB
- # of Slides 2
- File Format PPTX
- Slide Ratio 16:9
- Color
Keywords
About the Product
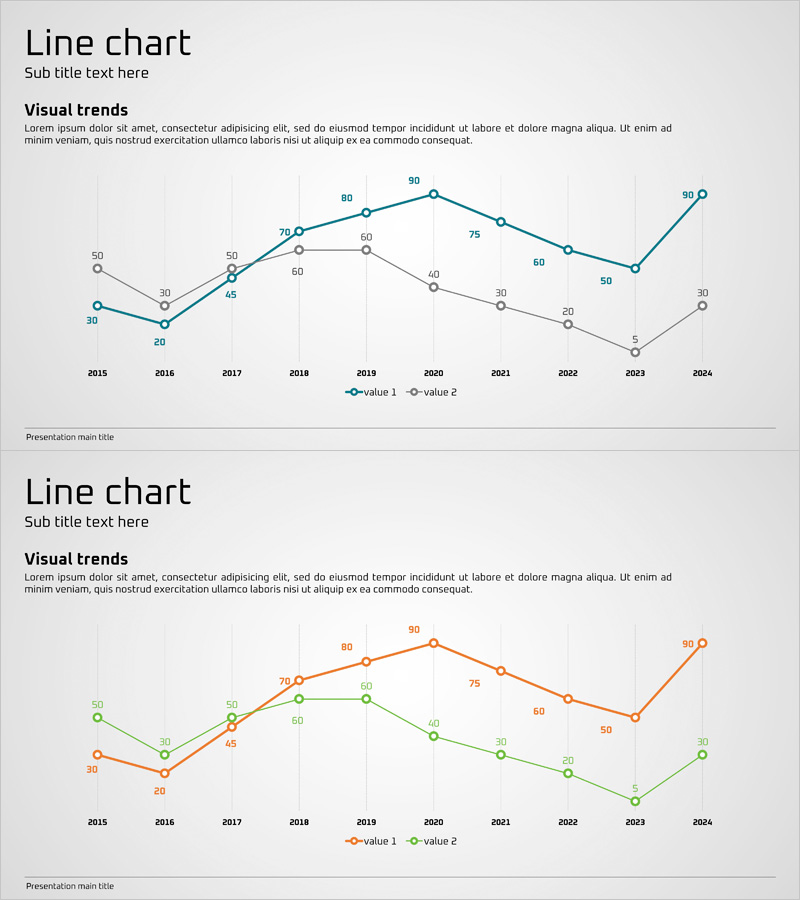
A dual-series line chart PowerPoint slide comparing data trends from 2015 to 2024 across a 10-year period. The visualization uses three distinct colors—blue, orange, and green—to differentiate data points and trend lines, ensuring visual clarity and easy interpretation. Each year's numerical values are explicitly labeled, making it ideal for presenting market trends, revenue changes, performance comparisons, and business metrics. This 16:9 widescreen 2-slide set is ready for immediate use in presentations, reports, business plans, and strategic documents.
Usage Points
-
Main Usage
Designed to simultaneously compare and analyze changes in two or more data series over time. Effectively visualizes market trends, revenue progression, competitive benchmarking, and performance metrics, providing clear visual evidence for strategic decision-making and stakeholder communication.
-
How to Use
Replace the sample data points and values with your actual dataset for each year. Customize the legend labels (Value 1, Value 2) to match your document context. Adjust colors, line thickness, and marker styles as needed. During presentation, emphasize trend inflection points—peaks and valleys—to highlight key insights and business implications.
-
Recommended For
Ideal for marketing plans, business reports, investor presentations, quarterly performance reviews, executive briefings, and market analysis documents. Commonly used by sales, planning, analytics, and finance teams to support data-driven decision-making and stakeholder reporting.
-
Slide Structure
Comprises two data series represented by blue and orange lines, with a third green reference line, spanning 10 data points from 2015 to 2024. Each value is marked with a circular node. Vertical gridlines and horizontal axis labels facilitate data reading. Includes title, subtitle, and legend areas in a complete, production-ready slide layout.
Related Products
-

Car Wide Template Line Chart – Market and Competitive Analysis
#Business Introduction #Market and Competitor Analysis #Graph
-

Camping Market Future Outlook Graph
#Market and Competitor Analysis #Graph #Future Outlook
-

Curved Graphs and Analysis Messages – Market and Competitor Analysis
#Market and Competitor Analysis #Graph #Competitor Analysis
-

Color Theme Presentation Template for Line Charts
#Business Strategy #Market and Competitor Analysis #Graph
