Visualizing Market Analysis with Modern Blue Line Chart – Digital Marketing Strategy
RJ0200035_26
- Last Update 04/07/2025
- File Size 4MB
- # of Slides 2
- File Format PPTX
- Slide Ratio 16:9
- Color
Keywords
About the Product
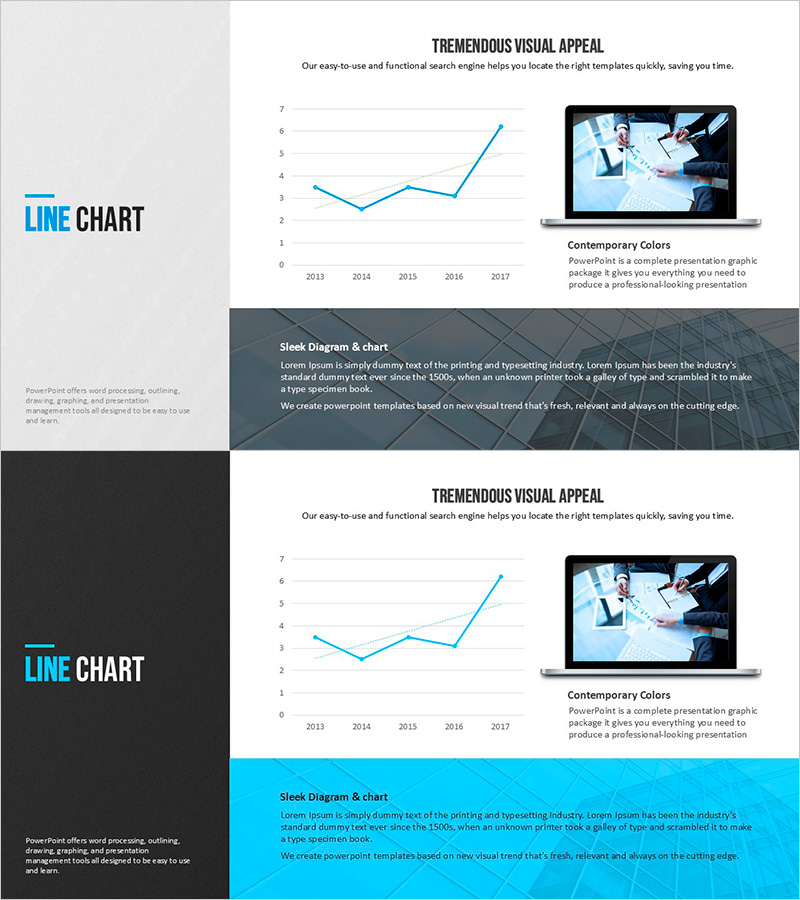
A professional line chart PowerPoint slide visualizing market data trends from 2013 to 2017 in a modern blue color scheme. This presentation template features a five-point line graph paired with a laptop screen mockup image, making it ideal for digital marketing strategy presentations and business reports. The two-slide deck includes a light background version emphasizing the chart and a dark gray background version with dedicated text space for detailed explanations. The slides are fully editable and ready to download for immediate use in your next presentation or business deck.
Usage Points
-
Main Usage
Clearly visualizes numerical changes and trends over time, making it ideal for presenting year-over-year data such as revenue growth, website traffic, conversion rates, and performance metrics. The line chart format allows audiences to instantly grasp trends and patterns.
-
How to Use
Use in marketing strategy presentations, quarterly performance reports, and market analysis decks as your data visualization section. Present the first slide to highlight the chart, then transition to the second slide to provide detailed insights and supporting commentary.
-
Recommended For
Marketing professionals, executives, data analysts, and consultants presenting quarterly reports, strategic planning sessions, and investor pitches. Particularly suited for digital marketing, business intelligence, financial analysis, and performance review presentations.
-
Slide Structure
Two-slide template. Slide 1: Light gray background with blue line chart (5 data points spanning 2013–2017 on X-axis, 0–7 scale on Y-axis) and laptop screen mockup positioned in the upper right. Slide 2: Dark gray background with the same chart at the top and a text block below for title and description content.
Related Products
-

IT Service Future Outlook and Expected Effects Graph – Analyzing Impact
#Business Strategy #Market and Competitor Analysis #Graph
-

Service Future Outlook Graph – Visualized in Blue, Orange, and Green
#Market and Competitor Analysis #Graph #Future Outlook
-

Visualizing Future Outlook and Expected Effects – Harmony of Green and Orange
#Business Strategy #Market and Competitor Analysis #Graph
-

Trend in the Number of Crimes – Visual Data Analysis
#Business Strategy #Market and Competitor Analysis #Graph
