Project Progress and Future Direction – Clear Vision Presentation
RJ0400017_30
- Last Update 05/22/2025
- File Size 0.2MB
- # of Slides 2
- File Format PPTX
- Slide Ratio 16:9
- Color
Keywords
- #Content-Based Slides
- #Design-Based Slides
- #Business Strategy
- #Technical Approach
- #Graph
- #Text Box
- #Other
- #Future Development Roadmap
- #Arrow
- #Project Progress
- #16:9
- #project progress PowerPoint slide
- #business direction presentation
- #progress comparison slide
- #business performance PPT
- #arrow diagram slide
About the Product
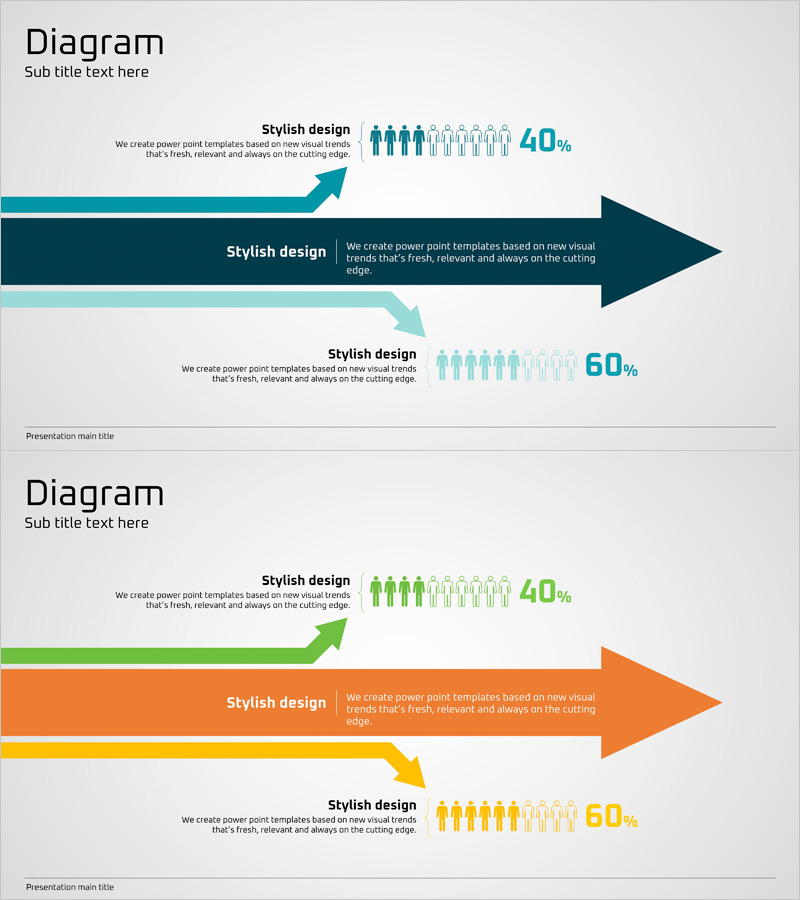
A PowerPoint slide that clearly visualizes business progress and future development direction using arrow-based infographics. The three-stage comparison structure with arrows and icons enables simultaneous presentation of current status, key achievements, and future plans. Teal, orange, and yellow color combinations distinctly differentiate each stage, while people icons and percentage data effectively communicate quantitative results. This presentation slide is ready to use in business reports, investor briefings, and executive presentations.
Usage Points
-
Main Usage
Present both current business progress and future development direction simultaneously to provide stakeholders with a clear vision. Combine quantitative performance metrics (percentages) with qualitative direction to support decision-making.
-
How to Use
Ideal for executive reports, investor presentations, and business briefings where comparing current progress with future plans is essential. Simply replace text and percentage values with your own data for immediate use in presentations.
-
Recommended For
Business managers, project managers, executives, and investor relations professionals. Effective for quarterly business progress reports, annual business plan presentations, and new project status updates.
-
Slide Structure
Two-slide layout featuring teal arrow three-stage structure on the first slide and orange-yellow arrow three-stage structure on the second. Each stage includes two text input areas (title and description), people icon groups, and percentage display spaces for flexible data entry.
Related Products
-

Blackboard Chalk Theme Market Analysis Graph – Creative Data Visualization
#Technical Approach #Market and Competitor Analysis #Graph
-

Orange Green Achievement Graph – Visualizing Goal Attainment
#Business Strategy #Market and Competitor Analysis #Graph
-

Modern Business PowerPoint Template – Business Strategy and Market Analysis
#Business Strategy #Market and Competitor Analysis #Graph
-

Modern Business Presentation Template Line Chart
#Business Strategy #Market and Competitor Analysis #Graph
