Business Trend and Status Analysis – Utilizing Doughnut Chart
RJ0400017_12
- Last Update 05/21/2025
- File Size 0.4MB
- # of Slides 2
- File Format PPTX
- Slide Ratio 16:9
- Color
Keywords
About the Product
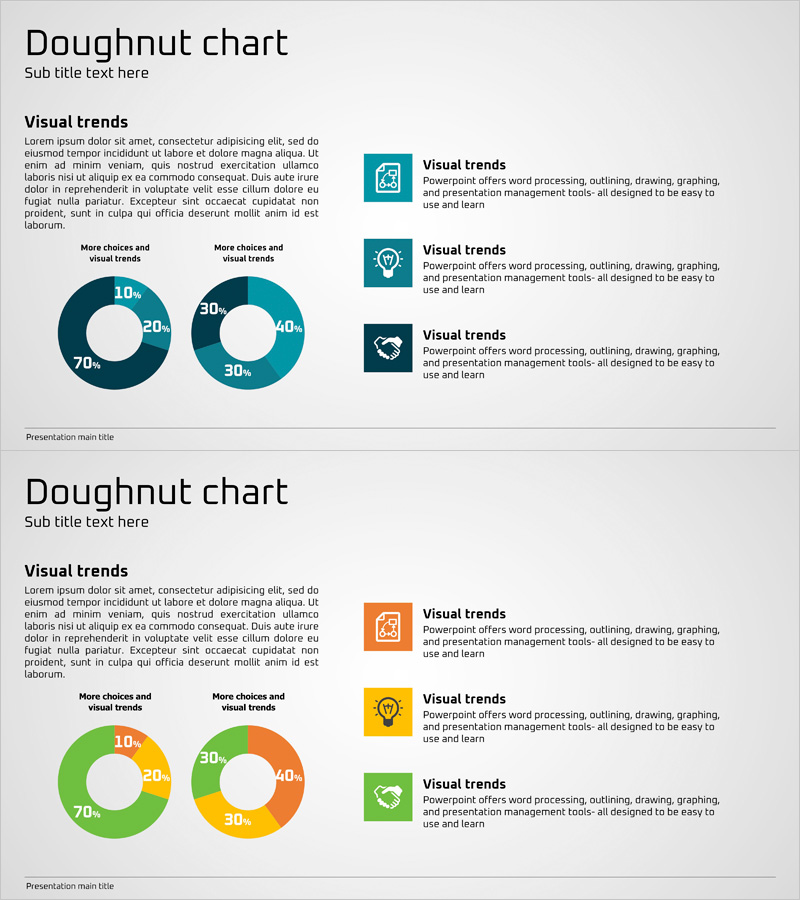
A 2-slide PowerPoint presentation featuring doughnut charts for business trend and status analysis. The slides utilize teal and orange color schemes to visualize ratio comparisons and component breakdowns with 4-5 data points per chart. The right side of each slide includes icon blocks and text description areas for enhanced information delivery. Formatted in 16:9 widescreen PPTX, these slides are fully editable and suitable for business reports, marketing analysis presentations, and strategic briefings.
Usage Points
-
Main Usage
Visualizes business composition ratios and comparative metrics at a glance. Doughnut charts effectively illustrate part-to-whole relationships, making them ideal for market share analysis, departmental budget allocation, customer demographic breakdowns, and other ratio-based data presentations.
-
How to Use
Double-click the doughnut chart data to edit values directly, or input key descriptive text in the right-side icon blocks. Colors can be modified globally through theme color changes, and fonts and backgrounds can be adjusted via the slide master.
-
Recommended For
Executive reports, business performance briefings, marketing analytics presentations, financial status reviews, and organizational structure introductions. Particularly valuable for executives, marketing professionals, and financial analysts who need to communicate quantitative data-driven insights.
-
Slide Structure
2-slide set with dual doughnut charts on the left (4-5 data points each) and icon blocks with text descriptions on the right. Charts feature teal and orange gradient fills with percentage values displayed for each segment.
Related Products
-

Big Data Comprehensive Analysis Chart – Insights for Market Analysis
#Business Introduction #Market and Competitor Analysis #Diagram
-

Business Status and Market Analysis Doughnut Slide – Harmony of Blue and Orange
#Business Introduction #Market and Competitor Analysis #Diagram
-

Service Technology Analysis Circle Graph – Market Analysis and Technology Status
#Business Introduction #Market and Competitor Analysis #Diagram
-

Analysis Graph by Car Type – Insights with Doughnut Chart
#Business Introduction #Market and Competitor Analysis #Graph
