Medical Market Analysis Vertical Bar Graph
RJ0400015_4
- Last Update 05/21/2025
- File Size 1.5MB
- # of Slides 2
- File Format PPTX
- Slide Ratio 16:9
- Color
Keywords
About the Product
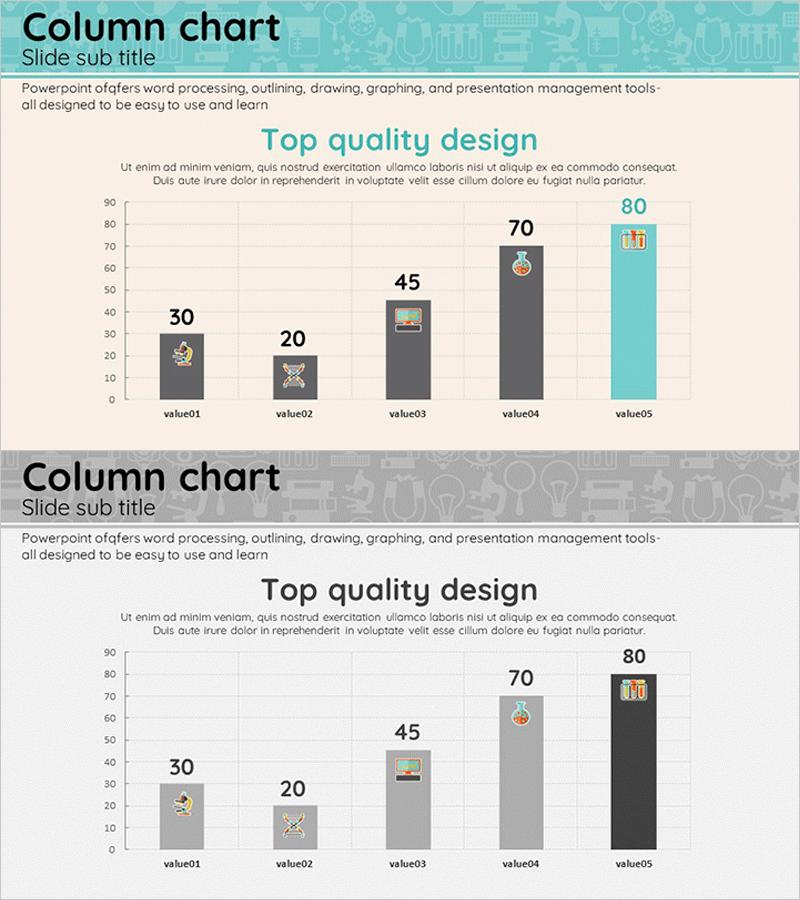
A vertical bar chart PowerPoint slide optimized for medical industry market analysis presentations. This template effectively displays comparative data across five items, making it ideal for presenting market size, growth rates, competitive market share, and revenue trends in medical devices, pharmaceuticals, and healthcare sectors. The design uses a teal and gray color palette to highlight key data points, with clear numerical labels displayed above each bar. The 2-slide set provides two background options—light and dark tones—allowing you to match your presentation's overall design aesthetic. Fully editable PPTX format for immediate customization.
Usage Points
-
Main Usage
Presents quantitative medical industry data—market size, growth rates, competitive share, and revenue trends—in a clear, comparative format. The bar heights enable instant visual comparison of relative values, making this template essential for market analysis sections in business plans, proposals, and investor pitch decks.
-
How to Use
Open the slide and replace the numerical values and labels with your own data. Choose between the light or dark background version to match your presentation's overall tone and design consistency. Bar colors and numerical labels can be adjusted as needed to align with your branding or data emphasis.
-
Recommended For
Ideal for medical device companies, pharmaceutical firms, hospitals, and healthcare startups preparing business plans, investor presentations, market analysis reports, and executive briefings. Also valuable for healthcare consulting firms, medical marketing professionals, and healthcare industry analysts delivering data-driven presentations.
-
Slide Structure
2-slide set, each featuring a title area (Column chart, Slide sub title), descriptive text, and a 5-item vertical bar graph. Bars are labeled value01 through value05 with corresponding numerical values (30, 20, 45, 70, 80) displayed as labels above each bar. Two background versions provided: light beige-teal tone and dark gray tone.
Related Products
-

Market Trends and Analysis – Harmony of Blue and Red
#Market and Competitor Analysis #Diagram #Graph
-

Comparative Analysis of Eco-Friendly Categories Slide – Market Competitive Advantage
#Market and Competitor Analysis #Financial Plans and Performance #Diagram
-

Vertical Bar Graph Template for Business Plan
#Market and Competitor Analysis #Graph #Competitor Analysis
-

Business Plan Presentation Template - World Wide Map
#Market and Competitor Analysis #Financial Plans and Performance #Graph
