Laboratory Beaker Shape Comparison Graph
RJ0400015_17
- Last Update 05/21/2025
- File Size 0.6MB
- # of Slides 2
- File Format PPTX
- Slide Ratio 16:9
- Color
Keywords
About the Product
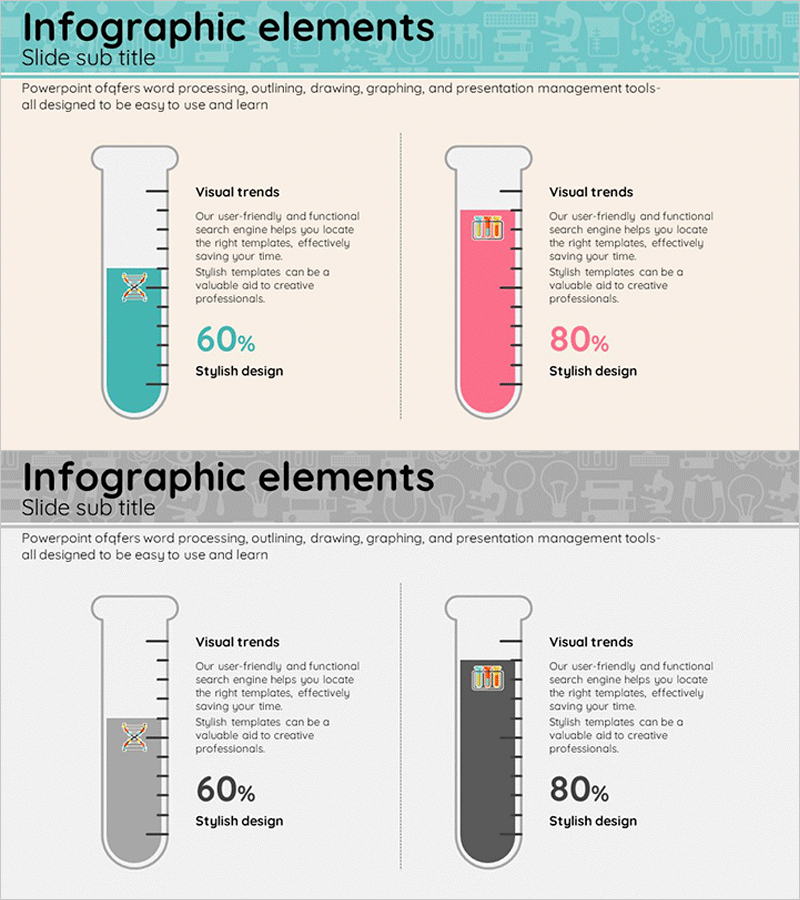
A unique comparison graph PowerPoint slide featuring laboratory beaker-shaped infographic elements. This presentation template uses teal and pink color schemes to display comparative data such as competitive analysis, product performance metrics, and market share comparisons. Each beaker includes percentage value fields and descriptive text areas, making it ready for immediate use in business reports, marketing presentations, and analytical slideshows. The 16:9 widescreen format with 2-slide layout allows you to present multiple data comparisons effectively.
Usage Points
-
Main Usage
This beaker-shaped graph is optimized for data comparison in scientific, technical, and analytical presentations. It effectively displays two-item numerical comparisons such as competitive benchmarking, product performance indicators, and market data contrasts. The teal and pink color contrast ensures clear data differentiation and visual impact.
-
How to Use
Enter percentage values into each beaker shape and add descriptive text in the right-side text area. During presentations, designate the left beaker for baseline data and the right beaker for new data to emphasize changes and improvements. Colors can be customized to match your brand identity or corporate guidelines.
-
Recommended For
Ideal for scientific and technical field reports, competitive analysis sections in marketing plans, product development presentations, market research findings, and performance comparison analyses. Recommended for executive briefings requiring data-driven decision-making and investor pitch decks.
-
Slide Structure
The 2-slide layout features two beaker shapes per slide arranged side-by-side. The left beaker displays in teal and the right in pink for color-coded distinction. Each beaker contains a percentage value input field, with descriptive text areas positioned to the right. A title area at the top accommodates comparison category labels.
Related Products
-

Curved Area Graph for Market Analysis Visualization – Insights Provided
#Market and Competitor Analysis #Diagram #Graph
-

Gender Ratio Analysis Graph Chart – Data Visualization and Customer Insights
#Market and Competitor Analysis #Graph #Other
-

Segmented Square 3D Graph: Market & Competitive Analysis
#Market and Competitor Analysis #Graph #Other
-

Detailed Bundled Bar Chart – Market and Competitor Analysis
#Market and Competitor Analysis #Graph #Market Status
