Curved Area Graph for Market Analysis Visualization – Insights Provided
RJ0300055_12
- Last Update 05/03/2025
- File Size 2.9MB
- # of Slides 2
- File Format PPTX
- Slide Ratio 16:9
- Color
Keywords
- #Content-Based Slides
- #Design-Based Slides
- #Market and Competitor Analysis
- #Diagram
- #Graph
- #Competitor Analysis
- #Market Analysis
- #Cluster
- #Other
- #Chain Diagram
- #Other Charts
- #16:9
- #curved area graph PowerPoint
- #area chart slide template
- #market analysis visualization
- #multi-series graph
- #trend analysis presentation slide
About the Product
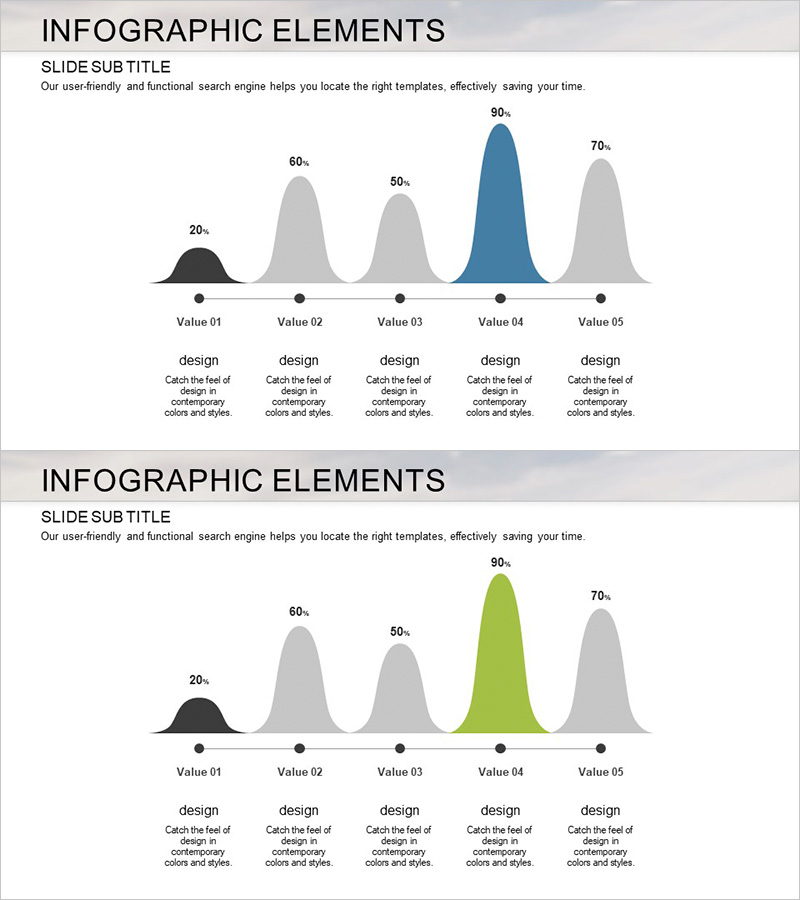
A PowerPoint slide featuring a 5-series curved area graph for visualizing market data and competitive trends. The design uses gradient fills in black, gray, blue, and green tones to distinguish each data series, with percentage values and clear labels displayed throughout. Ideal for market analysis, competitor comparison, revenue trends, and customer segmentation presentations. The 16:9 format with 2 slides enables immediate integration into business presentations and reports.
Usage Points
-
Main Usage
Designed to compare five or more data series simultaneously and communicate market trends, competitive positioning, revenue growth, and customer distribution visually. The overlapping gradient areas intuitively represent relative proportions and temporal changes.
-
How to Use
Insert into market analysis sections of business reports, strategy presentations, and marketing plans. Update data values to automatically refresh the area graph; colors and labels are fully editable. Particularly effective for highlighting quarterly or annual data changes and comparative performance.
-
Recommended For
Marketing managers, executives, data analysts, and consultants presenting market conditions, competitive landscape, and growth trajectories. Suitable for investor presentations, executive briefings, strategy meetings, and client proposals.
-
Slide Structure
2-slide set. First slide features dark background with blue-highlighted series; second slide uses light background with green-highlighted series. Each slide contains 5 gradient areas, 5 data points with percentage labels, and descriptive text fields below for series explanations.
Related Products
-

Segmented Square 3D Graph: Market & Competitive Analysis
#Market and Competitor Analysis #Graph #Other
-

Service Analysis Radial Graph – Market and Competitor Analysis
#Market and Competitor Analysis #Diagram #Graph
-

Market Distribution Comparison Graph – Trends and Analysis
#Market and Competitor Analysis #Diagram #Graph
-

Fintech Market Analysis Bar Graph – Clear Data Visualization
#Market and Competitor Analysis #Diagram #Graph
