Graph Slide for Service Future Outlook – Harmony of Green and Navy
RJ0400014_6
- Last Update 05/21/2025
- File Size 0.1MB
- # of Slides 2
- File Format PPTX
- Slide Ratio 16:9
- Color
Keywords
About the Product
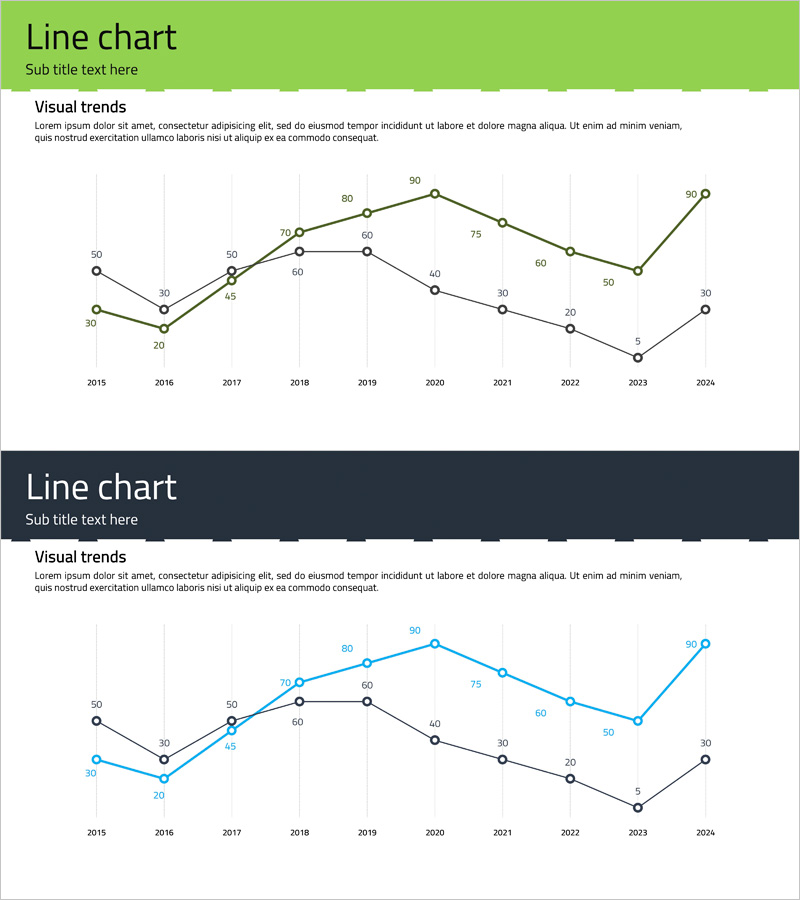
A multi-series line chart PowerPoint slide comparing 10 years of market trends from 2015 to 2024 across three data series. The contrasting green and navy color scheme clearly distinguishes each series, while data point values are labeled for precise information delivery. This presentation slide is ready to use for service outlook forecasts, market growth analysis, competitive benchmarking, and business performance reviews. Provided in 16:9 widescreen format with 2 slides, all values and labels are fully editable in PowerPoint for customization to your specific business context.
Usage Points
-
Main Usage
Visualize data changes over time and compare multiple series simultaneously to identify trends and patterns. Ideal for demonstrating service growth projections, market performance, revenue trends, customer satisfaction evolution, and competitive positioning across extended time periods.
-
How to Use
Insert into the market analysis section of business plans, quarterly performance reports, and investor pitch decks to demonstrate growth potential. Replace sample values with actual business metrics, customize axis labels and legend text to match your presentation context, and adjust color emphasis as needed.
-
Recommended For
Executive presentations to leadership and board members, investor and shareholder communications, marketing team market analysis briefings, sales team growth demonstrations, and consultant trend analysis reports. Particularly effective when emphasizing long-term performance trajectories and competitive advantages.
-
Slide Structure
Two-slide set featuring identical line chart layouts with different color emphasis. Each slide displays 3 data series across 10 years (2015–2024) on X-axis and 0–100 scale on Y-axis. Includes gridlines, circular data point markers, labeled values at each point, and clear legend differentiation between series.
Related Products
-

Trend Color Wide Template Line Chart – Market Trend Analysis
#Market and Competitor Analysis #Graph #Future Outlook
-

Line Graph Market Research by Year – Market Trend Analysis
#Market and Competitor Analysis #Graph #Future Outlook
-

Paint Splash Template Line Chart - Successful Business Strategy
#Business Strategy #Market and Competitor Analysis #Graph
-

Curve Chart of Architectural Topics
#Market and Competitor Analysis #Graph #Competitor Analysis
