Competitor Analysis Bilinear Bar Graph
RJ0400011_9
- Last Update 05/20/2025
- File Size 0.3MB
- # of Slides 2
- File Format PPTX
- Slide Ratio 16:9
- Color
Keywords
- #Content-Based Slides
- #Design-Based Slides
- #Market and Competitor Analysis
- #Graph
- #Competitor Analysis
- #Horizontal Bar
- #Double Horizontal Bar
- #16:9
- #bilinear bar chart PowerPoint
- #competitor analysis slide template
- #horizontal bar graph comparison
- #dual-axis data visualization
- #market analysis chart template download
About the Product
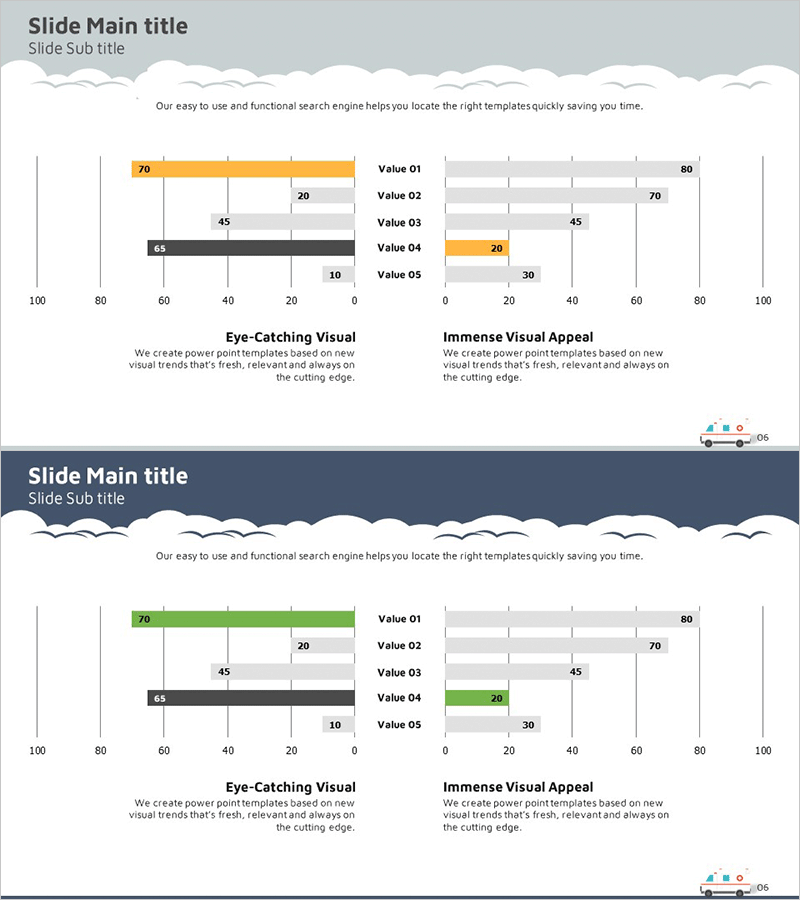
A bilinear bar chart PowerPoint slide designed for competitive analysis and market comparison. This template features left-facing bars on the left side and right-facing bars on the right side, creating a symmetrical layout that intuitively contrasts two data series. Orange and gray color coding clearly distinguishes between the two categories, with five data points (Value 01–05) ready for numerical input. The 2-slide deck in 16:9 widescreen format is ideal for presentations, reports, and strategic proposals where side-by-side data comparison is essential. Instantly applicable for competitive positioning, performance benchmarking, and market share analysis in business presentations.
Usage Points
-
Main Usage
This bilinear bar chart is optimized for competitive performance comparison, market share analysis, and dual-axis data visualization. The symmetrical structure—with left-facing bars on one side and right-facing bars on the other—clearly highlights differences between two data series, allowing instant numerical input to reflect real-time data.
-
How to Use
Enter numerical values for each item (Value 01–05) and the bar lengths adjust automatically. Use the left-facing bars to represent competitors, previous periods, or alternative scenarios, and the right-facing bars for your company, current periods, or preferred options. The orange and gray color distinction provides immediate visual clarity without additional formatting.
-
Recommended For
Marketing teams presenting competitive analysis reports, sales teams showcasing market positioning, executive strategy briefings, business plan market analysis sections, and quarterly performance comparison reports. Ideal for any presentation requiring quantitative side-by-side data comparison across industries and departments.
-
Slide Structure
Two-slide template with each slide featuring a bilinear layout: left side displays four reverse-facing horizontal bars (Value 01–04), right side displays five forward-facing bars (Value 01–05). Title area at top, chart in center, descriptive text area at bottom. Standardized 0–100 scale axis ensures consistent data representation across both sides.
Related Products
-

Gender Ratio Bar Graph – Market and Competitor Analysis
#Market and Competitor Analysis #Graph #Competitor Analysis
-

Competitive Advantage Bar Graph – Market and Competitor Analysis
#Market and Competitor Analysis #Graph #Competitor Analysis
-

Business Competitor Analysis Graph
#Market and Competitor Analysis #Graph #Competitor Analysis
-

Business Bi-level Bar Graph – Optimized for Competitor Analysis
#Market and Competitor Analysis #Graph #Competitor Analysis
