Carbon Neutral Service Implementation Diagram - A Clear and Efficient Roadmap
RJ0600018_11
- Last Update 06/25/2025
- File Size 12.6MB
- # of Slides 2
- File Format PPTX
- Slide Ratio 16:9
- Color
Keywords
- #Content-Based Slides
- #Design-Based Slides
- #Technical Approach
- #Diagram
- #Service Implementation Plan
- #Service Implementation Plan
- #Flow
- #Linear Flow
- #16:9
- #linear diagram PowerPoint slide
- #4-stage process flow
- #carbon neutral implementation roadmap
- #sequential process diagram
- #service roadmap PowerPoint template
About the Product
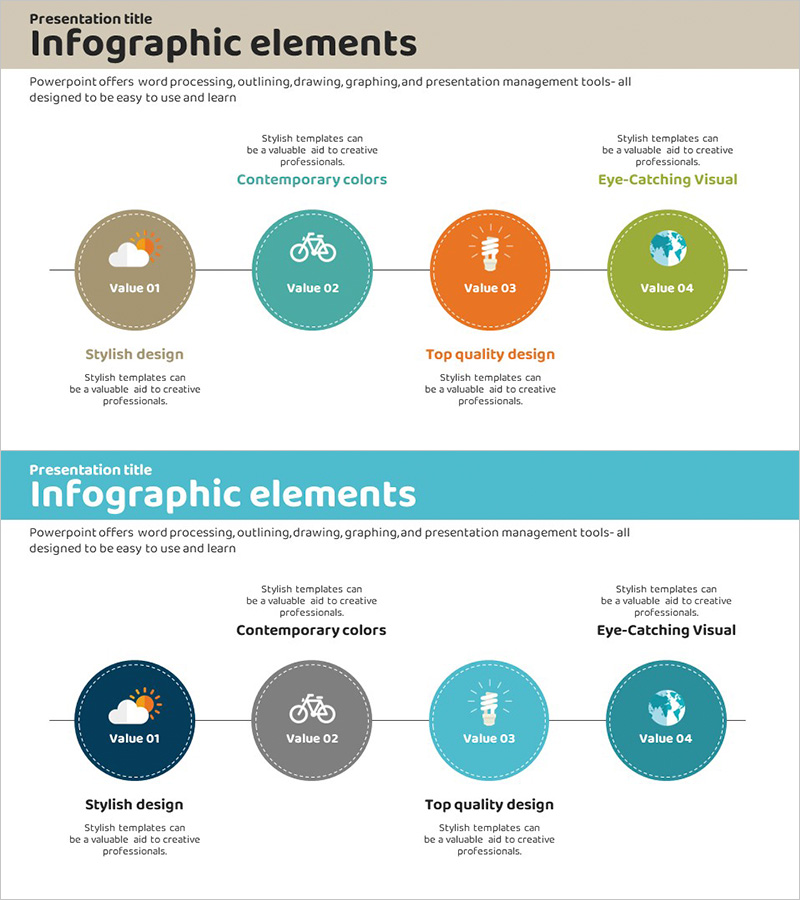
A linear diagram PowerPoint slide that clearly presents a carbon neutral service implementation strategy across four sequential stages. Four circular nodes in beige, teal, orange, and lime green are connected by a horizontal line, intuitively conveying process flow and progression. Each node features an icon and text area for entering stage names, objectives, and outcomes. The 2-slide set includes two background color variations (beige and teal) for flexible presentation design. Delivered in 16:9 widescreen PPTX format, fully editable and ready for immediate use in corporate strategy presentations, sustainability reports, and service launch communications.
Usage Points
-
Main Usage
Visualizes carbon neutral service execution strategy in sequential stages to enhance audience comprehension. Color-coded circular nodes and icons emphasize each stage, directing attention and clarifying role and responsibility at each step. Ideal for corporate strategy presentations, environmental policy briefings, and service launch communications.
-
How to Use
Enter stage names, objectives, and responsible departments in each circular node's text area. Customize icons or adjust colors to match organizational branding. Choose between two background color options (beige or teal) to align with presentation tone and design consistency.
-
Recommended For
Recommended for sustainability officers, strategic planning teams, marketing departments, and executives preparing business reports. Particularly effective for carbon neutrality roadmaps, new service launch strategies, and organizational change management project presentations.
-
Slide Structure
Slide 1: Beige background with four circular nodes (teal, orange, lime, beige) connected by horizontal line. Each node contains icon, value label, and text area for descriptions. Slide 2: Teal header background with identical diagram layout for color variation. 16:9 widescreen format, 2-slide total composition.
Related Products
-

Circular Process Structure Slide - Service Execution Strategy
#Technical Approach #Diagram #Service Implementation Plan
-

Sleek Presentation Template Emphasizing Business Context
#Business Strategy #Operational Plan #Technical Approach
-

Green Blue Multidirectional Diagram
#Technical Approach #Diagram #Service Implementation Plan
-

Service Construction and Configuration Diagram – Visualizing Business Processes
#Technical Approach #Diagram #Service Architecture Diagram
