Visualizing Service Development Status and Market Share with Doughnut Chart
RJ0400010_10
- Last Update 05/19/2025
- File Size 0.2MB
- # of Slides 2
- File Format PPTX
- Slide Ratio 16:9
- Color
Keywords
- #Content-Based Slides
- #Design-Based Slides
- #Product/Service Introduction
- #Market and Competitor Analysis
- #Graph
- #Development Status
- #Market Share
- #Circles
- #Doughnut Chart
- #16:9
- #doughnut chart PowerPoint
- #pie chart slide template
- #ratio comparison chart
- #market share visualization
- #data visualization PowerPoint slide
About the Product
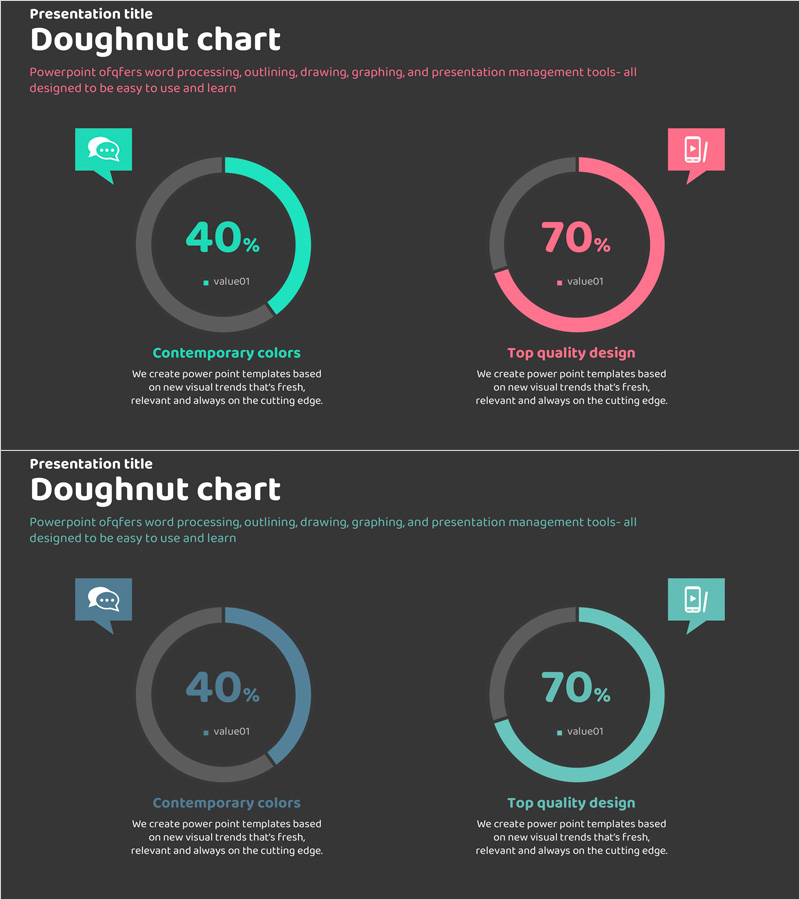
A PowerPoint slide template that visualizes service development status and market share using doughnut charts. Two contrasting color series—teal and pink—clearly represent dual data sets against a dark background, with icons and descriptive text enhancing readability. This 2-slide deck is ready to use in business reports, marketing presentations, and quarterly business reviews.
Usage Points
-
Main Usage
Simultaneously display two data series using doughnut charts to effectively communicate ratio comparisons and composition analysis. Optimized for percentage-based data visualization such as service development progress, market share, and customer satisfaction metrics.
-
How to Use
Insert into the performance analysis section of business reports, market analysis pages of marketing presentations, or business status slides in investor pitch decks. Edit chart values and labels with your own data and deploy immediately in presentations.
-
Recommended For
Business executives and project managers presenting quarterly business reviews or executive meetings; marketing teams visualizing market analysis results in strategy sessions; startups explaining service development progress to investors.
-
Slide Structure
Two-slide layout with two doughnut charts per slide. Each chart displays percentage values in the center, with icons and titles above and descriptive text below, creating a clear information hierarchy.
Related Products
-

Analysis of Work Progress – Utilizing Pie Chart
#Product/Service Introduction #Market and Competitor Analysis #Graph
-

Graph of Analysis of Transportation Development Status
#Product/Service Introduction #Market and Competitor Analysis #Graph
-

Analysis of Transportation Usage Status – Pie Chart
#Product/Service Introduction #Market and Competitor Analysis #Graph
-

Analysis graph of market share progress
#Product/Service Introduction #Market and Competitor Analysis #Graph
