Visualizing Efficient Execution Strategy – Differentiated Approach
RB0800074_9
- Last Update 03/28/2025
- File Size 0.3MB
- # of Slides 2
- File Format PPTX
- Slide Ratio 4:3
- Color
Keywords
- #Content-Based Slides
- #Design-Based Slides
- #Product/Service Introduction
- #Business Vision and Strategy
- #Diagram
- #Differentiation Strategy for Products/Services
- #Business Vision
- #Cluster
- #Closed Cluster Diagram
- #Chain Diagram
- #4:3
- #3-node connection diagram PowerPoint
- #circular node diagram slide
- #relationship visualization PPT
- #business structure diagram
- #diagram slide template download
About the Product
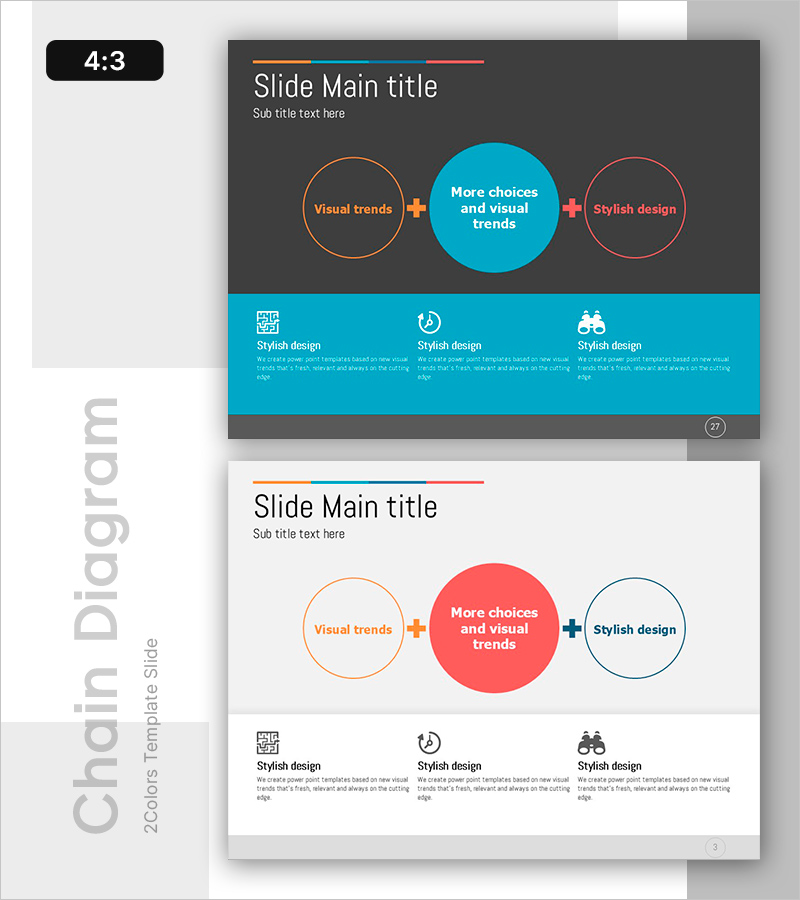
A three-node connection diagram PowerPoint slide that visualizes relationships between three key concepts. The central cyan circular node connects to left orange and right red circular nodes via plus-sign connectors, representing mutual influence and interaction. Set against a dark gray background with white typography for high contrast, the lower section features three icon-and-text areas for detailed descriptions. Delivered in 4:3 ratio PPTX format with 2 slides, ready for immediate use in strategy presentations, product introductions, and business vision communications.
Usage Points
-
Main Usage
Optimized to visualize relationships and mutual influence among three core concepts. The center-to-sides expansion structure effectively communicates cause-and-effect, interaction, and integrated strategy. Ideal for product introductions, business vision statements, and execution strategy phases where clarifying connections between key elements is essential.
-
How to Use
Enter concept names in each circular node and add detailed descriptions and icons to the three lower sections. Colors can remain as orange-cyan-red or be customized to match brand guidelines. The dark gray background ensures high readability in projector environments, and slide master editing allows consistent application across your entire presentation deck.
-
Recommended For
Suited for executives, planning teams, and marketing departments presenting strategies and proposals. Effective when explaining three-way interactions in new product launches, business expansion, organizational restructuring, and similar scenarios. Applicable to consulting reports, investor pitch decks, and internal strategy meeting materials.
-
Slide Structure
Title area at top + central 3-node connection diagram (1 cyan center circle, 1 orange left circle, 1 red right circle, 2 plus-sign connectors) + 3 icon-and-text sections at bottom. Two-slide set includes dark gray background version and white background version.
Related Products
-

Business Vision and Goals Slide – Cluster Diagram
#Business Vision and Strategy #Diagram #Business Vision
-

Astronomy Research Key Vision Diagram – Visualizing Innovation
#Product/Service Introduction #Business Introduction #Business Vision and Strategy
-

The Strength of the Media – Diagram Template for Presentation
#Product/Service Introduction #Diagram #Differentiation Strategy for Products/Services
-

Artificial Intelligence Core Vision Diagram
#Business Vision and Strategy #Diagram #Business Vision
