Easy Data Visualization with Area Chart Slide
RJ0400007_8
- Last Update 05/18/2025
- File Size 0.9MB
- # of Slides 2
- File Format PPTX
- Slide Ratio 16:9
- Color
Keywords
About the Product
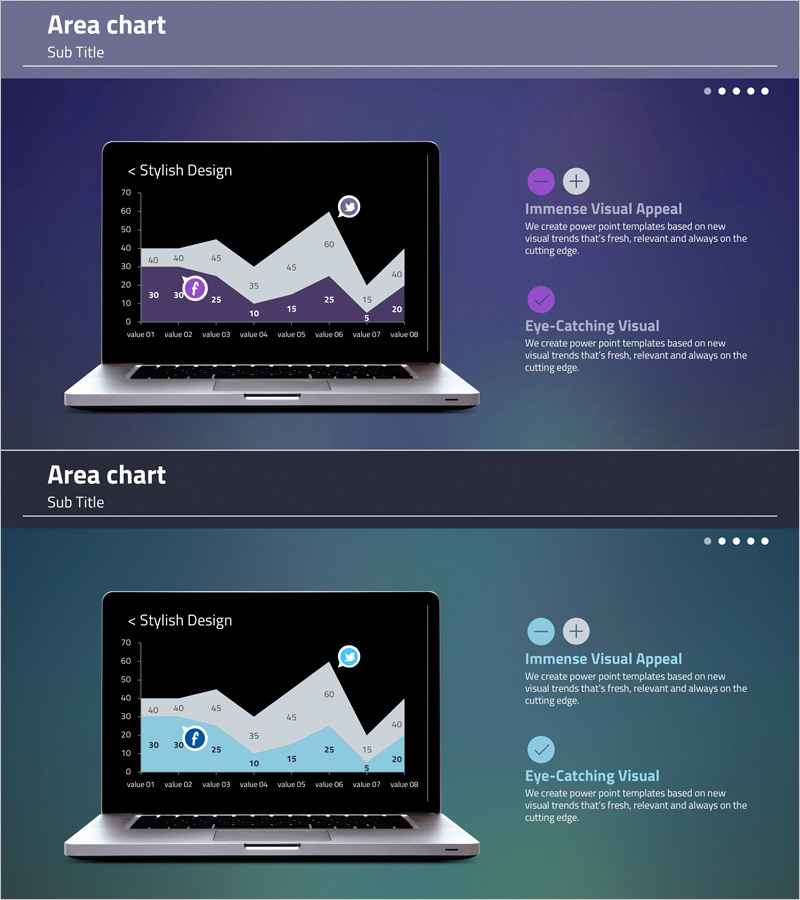
A PowerPoint slide featuring an area chart that visualizes time-series data trends with eight overlapping data series. The design uses a black background with purple and gray gradient areas and circular data point markers to clearly communicate numerical changes over time. Each series is distinctly colored to show both overall magnitude and individual contribution to the total. Perfect for presentations, reports, and analytical materials where you need to display multi-series trends such as revenue, traffic, or performance metrics across multiple categories or time periods.
Usage Points
-
Main Usage
Designed to display cumulative changes and individual series trends simultaneously. Area charts excel at showing both total magnitude and each component's contribution, making them ideal for revenue analysis, cost breakdown, traffic trends, and customer segment tracking across time periods.
-
How to Use
Input your data into the chart area on the black background, and the eight series will automatically display in distinct colors. Add your insights and interpretation in the text area on the right side to complete your presentation narrative. The slide is optimized for 16:9 widescreen format.
-
Recommended For
Financial and marketing analysis presentations, quarterly and annual performance reports, customer segment trend analysis, product usage and traffic change explanations, executive-level KPI dashboard presentations, and comparative performance tracking across multiple data series.
-
Slide Structure
Two-slide set. First slide features purple background with 8-series area chart, right-side explanation area with two circular icons and descriptive text. Second slide uses teal background with identical chart structure and explanation layout. Each slide can be used independently or as a paired comparison.
Related Products
-

Visualize Market Trends and Cash Flow with Area Charts!
#Market and Competitor Analysis #Financial Plans and Performance #Graph
-

Cement Theme Area Graph – Data Visualization Emphasizing Competitive Advantage
#Market and Competitor Analysis #Graph #Competitor Analysis
-

Competitive Analysis Area Diagram
#Market and Competitor Analysis #Graph #Competitor Analysis
-

Area Graph & Notebook Mockup for Market Trend Analysis
#Market and Competitor Analysis #Graph #Other
