Table Format Presentation Slide – Stylish Design
RJ0400007_17
- Last Update 05/18/2025
- File Size 0.5MB
- # of Slides 2
- File Format PPTX
- Slide Ratio 16:9
- Color
Keywords
- #Content-Based Slides
- #Design-Based Slides
- #Technical Approach
- #Diagram
- #Service Development Plan
- #Service Operation Plan
- #Flow
- #Table
- #Converging Flow Diverging Flow
- #Standard Table
- #16:9
- #data table PowerPoint slide
- #table template presentation
- #information organization slide
- #5-column table design
- #business data comparison
About the Product
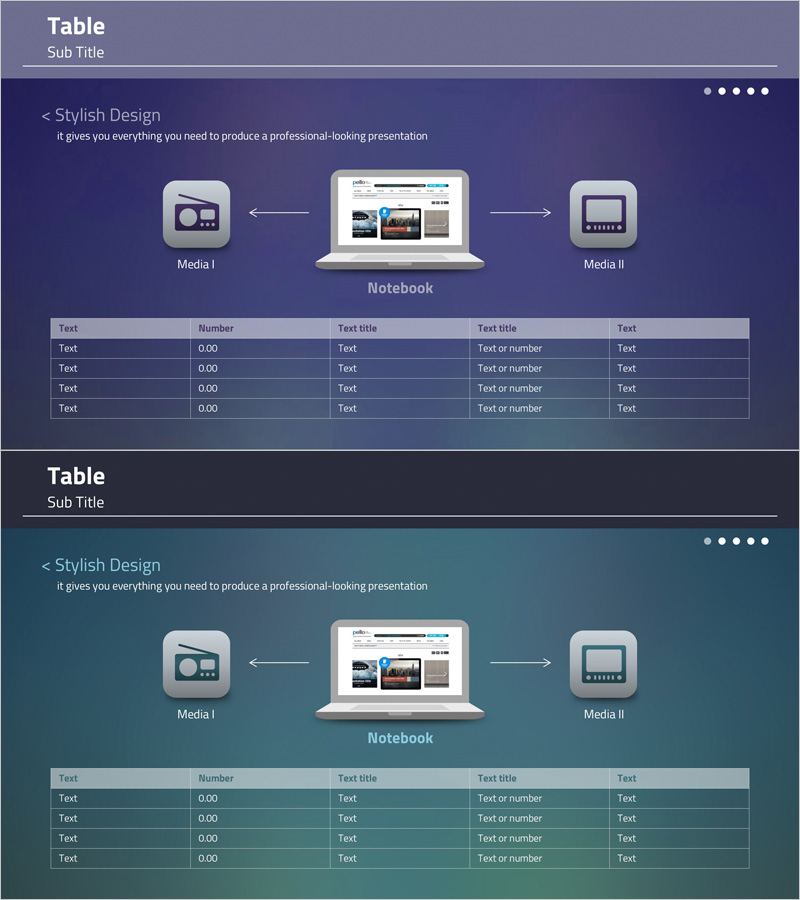
A professional 5-column data table PowerPoint slide designed to organize and present information systematically. The dark blue and teal two-tone color scheme creates a business-appropriate aesthetic, with clearly distinguished header and data rows optimized for numerical and text comparison. The 2-slide set features a media connection diagram at the top and an information input table below, allowing simultaneous presentation of process flow and result data. Delivered as an editable 16:9 widescreen PPTX file, perfect for reports, proposals, and analytical presentations.
Usage Points
-
Main Usage
Visualizes quantitative data and comparative information in table format to enhance audience comprehension. Ideal for numerical comparisons, feature descriptions, performance reporting, and results presentation, with clear header row emphasis to strengthen information hierarchy.
-
How to Use
Present process flow using the top media connection diagram, then input actual data into the bottom table to display results. When adding rows or columns, maintain the color pattern to ensure consistent slide design throughout your presentation.
-
Recommended For
Finance and marketing professionals preparing periodic reports, consultants presenting analysis results in proposals, academics sharing research data, and project managers conducting progress update meetings.
-
Slide Structure
Slide 1: Title area + 3 media icons + central notebook mockup + bidirectional connecting arrows / Slide 2: 5-column (Text·Number·Text·Text·Text) × 4-row data table with emphasized header row color coding
Related Products
-

Business Investment Differentiation Strategy Slide – Effective Business Execution
#Product/Service Introduction #Business Strategy #Diagram
-

Step-by-Step Gear System Presentation Template – Innovation and Efficiency
#Technical Approach #Diagram #Service Development Plan
-

Artificial Intelligence Donut Chart Analysis – A New Standard in Data Visualization
#Technical Approach #Graph #Other
-

Business Operations Plan Diagram – Visualization for Innovation and Efficiency
#Technical Approach #Diagram #Service Development Plan
