Business Investment Differentiation Strategy Slide – Effective Business Execution
RJ0300095_5
- Last Update 05/16/2025
- File Size 0.3MB
- # of Slides 2
- File Format PPTX
- Slide Ratio 16:9
- Color
Keywords
- #Content-Based Slides
- #Design-Based Slides
- #Product/Service Introduction
- #Business Strategy
- #Diagram
- #Differentiation Strategy for Products/Services
- #Flow
- #Table
- #Converging Flow Diverging Flow
- #Standard Table
- #Background
- #16:9
- #bidirectional arrow diagram PowerPoint
- #comparison analysis slide
- #two-stage process diagram
- #business investment strategy PPT
- #differentiation strategy slide
- #business execution diagram PowerPoint
About the Product
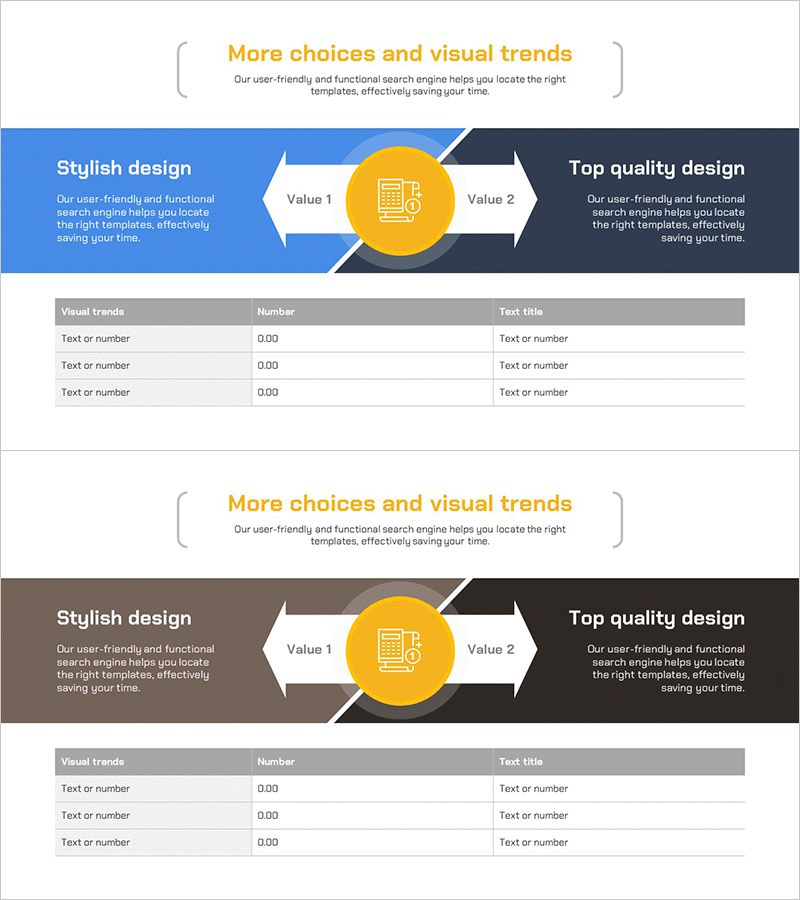
A bidirectional arrow diagram PowerPoint slide designed to visualize business investment and differentiation strategy. The slide features a blue, gray, and dark navy color palette with a symmetrical left-right structure, highlighted by a central yellow circular icon representing core value. The 2-slide set compares two perspectives on business execution strategy (stylish design vs. top quality design) side by side. A data table at the bottom allows you to add specific metrics and text information, making it ready for immediate use in pitch decks, business proposals, and executive reports.
Usage Points
-
Main Usage
Visualizes business investment strategy and differentiation points using symmetrical bidirectional arrows to emphasize balance between two perspectives. The central icon and arrow flow clearly communicate the core message, while the bottom data table organizes specific metrics to strengthen logical persuasiveness.
-
How to Use
Use in executive reports, investment proposals, and business planning presentations when comparing two strategic directions. Enter the first strategy (e.g., innovation, style) on the left and the second strategy (e.g., quality, stability) on the right, then organize commonalities and differences in the central icon and table.
-
Recommended For
Recommended for business planning teams, marketing teams, executives, and investor presentations. Particularly effective for new business initiatives, product differentiation explanations, and investment pitch scenarios where two strategic options must be compared simultaneously.
-
Slide Structure
2-slide set. Each slide features a symmetrical bidirectional arrow structure (2 nodes) with a central yellow circular icon. Layout includes title area at top, diagram area in center, and a 3-row data table at bottom (Visual trends, Number, Text title columns) for hierarchical information organization.
Related Products
-

Multi-Directional Strategy for Achieving Success – A Template for Business Future
#Product/Service Introduction #Business Vision and Strategy #Diagram
-

Mountaineering PPT Promotion Direction Diagram - Challenge and Success
#Product/Service Introduction #Business Strategy #Diagram
-

Big Data Business Service Marketing Strategy – Multidirectional Flow Diagram
#Product/Service Introduction #Marketing Plan and Strategy #Diagram
-

Academic Solutions Multidirectional Diagram
#Product/Service Introduction #Business Vision and Strategy #Diagram
