Business Operations Plan Diagram – Visualization for Innovation and Efficiency
RJ0300018_16
- Last Update 04/22/2025
- File Size 2.6MB
- # of Slides 2
- File Format PPTX
- Slide Ratio 16:9
- Color
Keywords
- #Content-Based Slides
- #Design-Based Slides
- #Technical Approach
- #Diagram
- #Service Development Plan
- #Service Operation Plan
- #Spread
- #Radial Diagram
- #16:9
- #radial diagram PowerPoint
- #expansion diagram slide
- #business operations plan presentation
- #how to create radial diagram in PowerPoint
- #3-direction expansion slide template
- #strategy visualization PowerPoint
About the Product
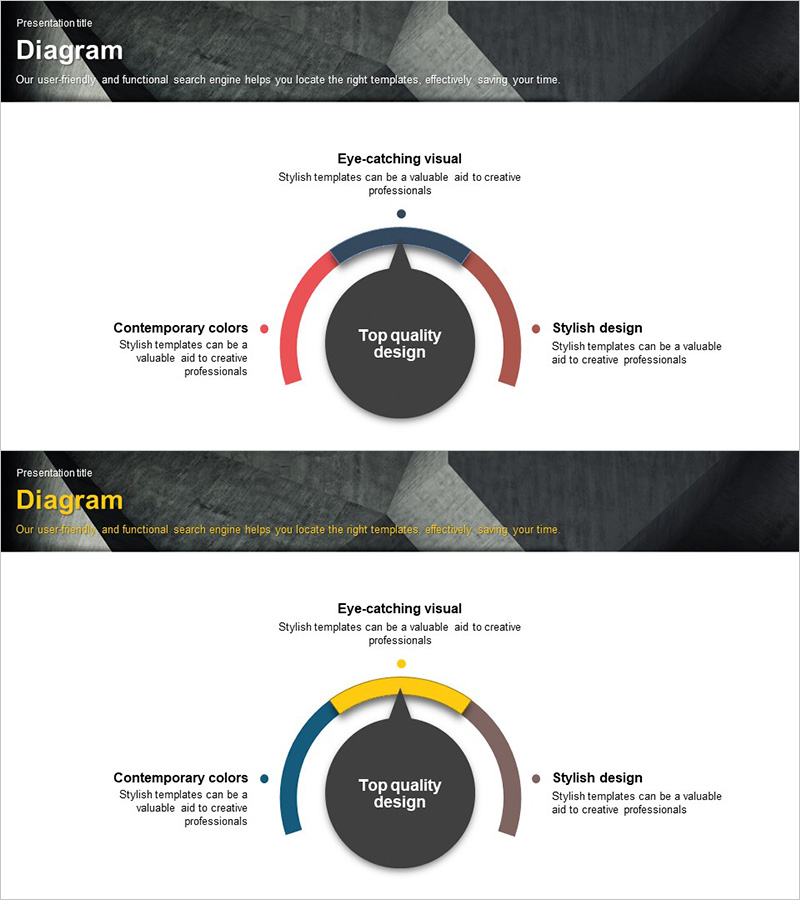
A radial diagram PowerPoint slide with three-directional expansion from a central concept. Features a dark charcoal center circle and red-brown arc-shaped expansion segments for visualizing business operations plans, innovation strategies, and efficiency improvements. The 2-slide set includes color variations (red, yellow, navy tones) optimized for 16:9 widescreen presentations. Ready-to-use for executive briefings, strategy meetings, and organizational restructuring presentations.
Usage Points
-
Main Usage
Optimized for expressing three strategies, directions, or elements radiating from a central concept simultaneously. Ideal for business operations plans, organizational innovation, efficiency improvements, and service development strategies requiring multi-layered expansion visualization.
-
How to Use
Replace the center circle text with your core business objective, then input strategic details, implementation plans, and expected outcomes in the three arc-shaped segments. Select color variations matching your presentation tone and use for executive reports, strategy meetings, and organizational communications.
-
Recommended For
Executive and C-suite strategy presentations, organizational restructuring explanations, business unit operations reports, technology roadmap visualizations, and marketing strategy meeting materials.
-
Slide Structure
2-slide set: Slide 1 features red and brown arc segments; Slide 2 includes yellow and navy variations. Each slide contains a central dark charcoal circular node with three arc-shaped expansion areas, providing four text input zones (one center + three expansion segments).
Related Products
-

Camping Isometric Project Service Operation Plan
#Technical Approach #Diagram #Service Operation Plan
-

Step-by-Step Gear System Presentation Template – Innovation and Efficiency
#Technical Approach #Diagram #Service Development Plan
-

Table Format Presentation Slide – Stylish Design
#Technical Approach #Diagram #Service Development Plan
-

Service and System Operation Plan Arrow Diagram
#Technical Approach #Diagram #Service Operation Plan
