Vertical Bar Graph for U.S. Market Analysis by Region – Sea Lighthouse
RJ0600079_24
- Last Update 07/11/2025
- File Size 3MB
- # of Slides 2
- File Format PPTX
- Slide Ratio 16:9
- Color
Keywords
About the Product
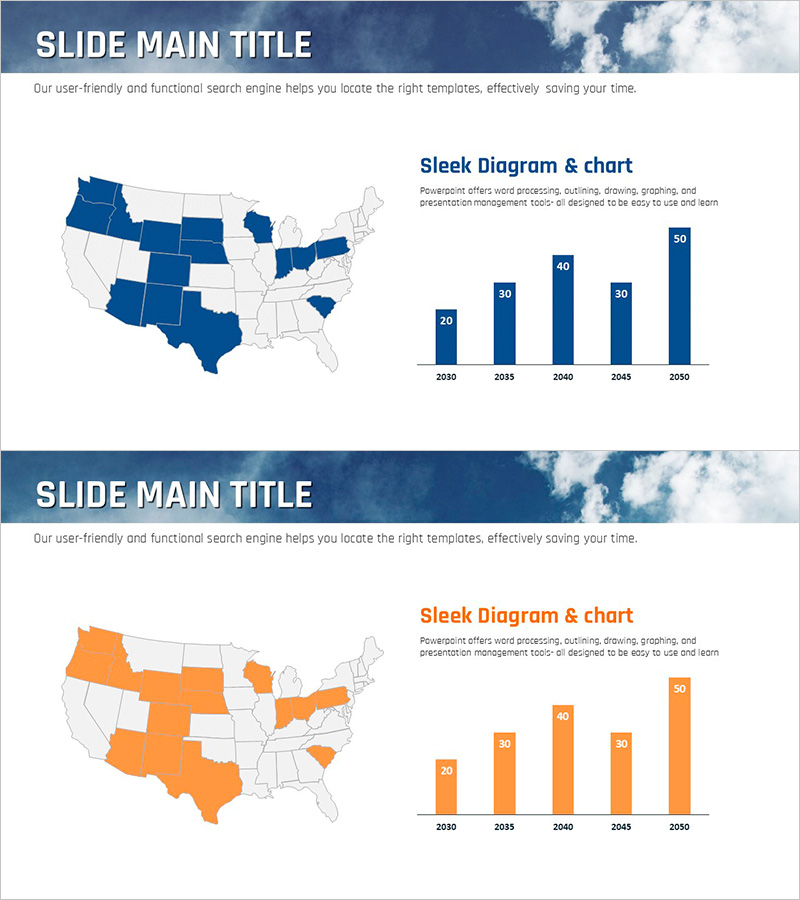
A vertical bar chart PowerPoint slide designed to visualize U.S. regional market data across five years (2030–2050). This template combines a geographic map showing state-level distribution with a corresponding bar graph, enabling clear comparison of regional performance metrics. Two color versions are included—deep navy blue and bright orange—allowing you to match your presentation style. The 2-slide set is ready to download and edit immediately for business reports, market analysis, and investor presentations.
Usage Points
-
Main Usage
Display regional market size, growth rates, or sales volume across multiple years in a single visual. The combination of map and bar graph allows you to communicate both geographic distribution and numerical trends simultaneously, making it ideal for international market overviews.
-
How to Use
Insert this slide into business plans, market analysis reports, and investor pitch decks to explain regional performance. Edit the bar heights and data labels directly to reflect your actual figures, and adjust colors to align with your corporate branding or presentation theme.
-
Recommended For
Marketing, sales, and strategy professionals presenting regional results to executives, investors, and clients. Particularly suited for international business, retail, manufacturing, and financial services industries discussing regional expansion strategies or market entry plans.
-
Slide Structure
Slide 1 features a deep navy background with a U.S. map (states color-coded by region) on the left and a vertical bar graph on the right showing five years of data (2030–2050) with numeric labels. Slide 2 uses an orange background with identical layout. Five data points per chart with clear axis labels.
Related Products
-

Horizontal Bar Chart Slide for USA Market Analysis
#Market and Competitor Analysis #Graph #Other
-

Target Country Market Analysis Graph
#Market and Competitor Analysis #Graph #Other
-

Global Target Market Analysis Graph
#Market and Competitor Analysis #Diagram #Graph
-

Global Regional Analysis Vertical Bar Graph - Insights from Regional Data
#Company Introduction #Market and Competitor Analysis #Graph
