Technology Status Diagram for the Earth Environment – Innovative Approach
RJ0400006_11
- Last Update 05/18/2025
- File Size 0.7MB
- # of Slides 2
- File Format PPTX
- Slide Ratio 16:9
- Color
Keywords
- #Content-Based Slides
- #Design-Based Slides
- #Product/Service Introduction
- #Business Introduction
- #Diagram
- #Development Status
- #Technological Status
- #Cluster
- #Spread
- #Inclusive Cluster Diagram
- #Decentralized Diagram
- #16:9
- #Venn diagram PowerPoint slide
- #three-circle diagram template
- #technology environment innovation
- #overlapping circles PPT
- #diagram slide design
About the Product
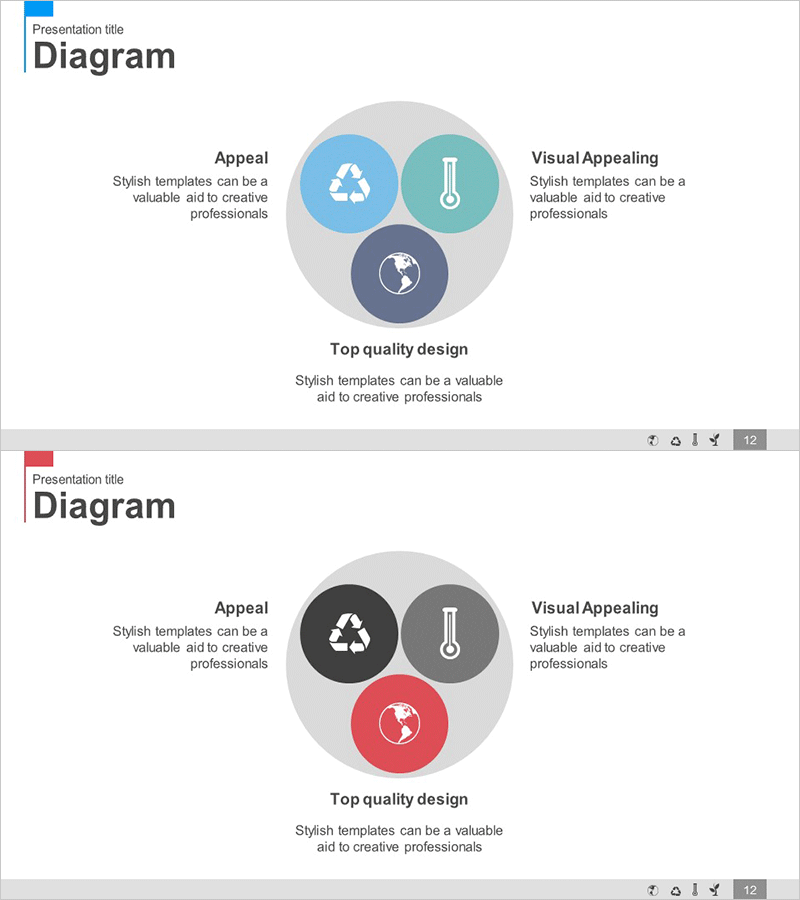
A three-circle Venn diagram PowerPoint slide that visualizes the interconnection between technology status, environmental concerns, and innovation strategy. The overlapping circles in blue, teal, and dark gray tones are positioned on a light gray background, each containing an icon and descriptive label. Two color variations (blue-dominant and red-accent versions) are included for flexible presentation styling. This design effectively communicates the intersection of technical advancement, environmental sustainability, and strategic innovation, making it ideal for corporate strategy presentations, environmental reports, academic seminars, and sustainability initiatives where multiple concepts need simultaneous visualization.
Usage Points
-
Main Usage
Illustrates the intersection and relationships between three interconnected concepts, particularly suited for explaining how technology, environmental factors, and innovation strategies overlap and influence each other. Commonly used in corporate strategy presentations, sustainability reports, technology briefings, and policy discussions.
-
How to Use
Edit the text labels and icons within each of the three circles to match your specific concepts. Customize the descriptive text on the left and right sides to align with your presentation narrative. Select between the two provided color variations based on your presentation theme and audience context. All elements are fully editable in PowerPoint.
-
Recommended For
Technology executives, environmental policy specialists, strategy consultants, sustainability officers, academic researchers, and corporate leadership teams. Particularly valuable for sustainability reporting, technology innovation presentations, environmental impact assessments, strategic planning sessions, and cross-functional team discussions.
-
Slide Structure
Three overlapping circles (approximately 80–100px diameter each) positioned centrally with icons (recycling symbol, thermometer, globe) and labels. Descriptive text areas flank the diagram on left and right sides. Title 'Diagram' appears at the top. Optimized for 16:9 widescreen format with balanced white space.
Related Products
-

Development Status by Technology Diagram Slide - Core Information
#Product/Service Introduction #Business Introduction #Diagram
-

Four Color Infographic – Business Status Presentation
#Product/Service Introduction #Business Introduction #Graph
-

Two Nested Diagrams – Product Introduction and Composition
#Product/Service Introduction #Diagram #Features
-

Eco-Oriented Meeting & Collaboration Map – A Guide for Business Innovation
#Technical Approach #Marketing Plan and Strategy #Diagram
