Two Nested Diagrams – Product Introduction and Composition
RB0800020_16
- Last Update 03/21/2025
- File Size 1.3MB
- # of Slides 2
- File Format PPTX
- Slide Ratio 4:3
- Color
Keywords
- #Content-Based Slides
- #Design-Based Slides
- #Product/Service Introduction
- #Diagram
- #Features
- #Composition
- #Cluster
- #Spread
- #Inclusive Cluster Diagram
- #Decentralized Diagram
- #4:3
- #nested diagram PowerPoint
- #cluster diagram slide template
- #product introduction slide
- #4-item diagram
- #relationship chart PPT slide
About the Product
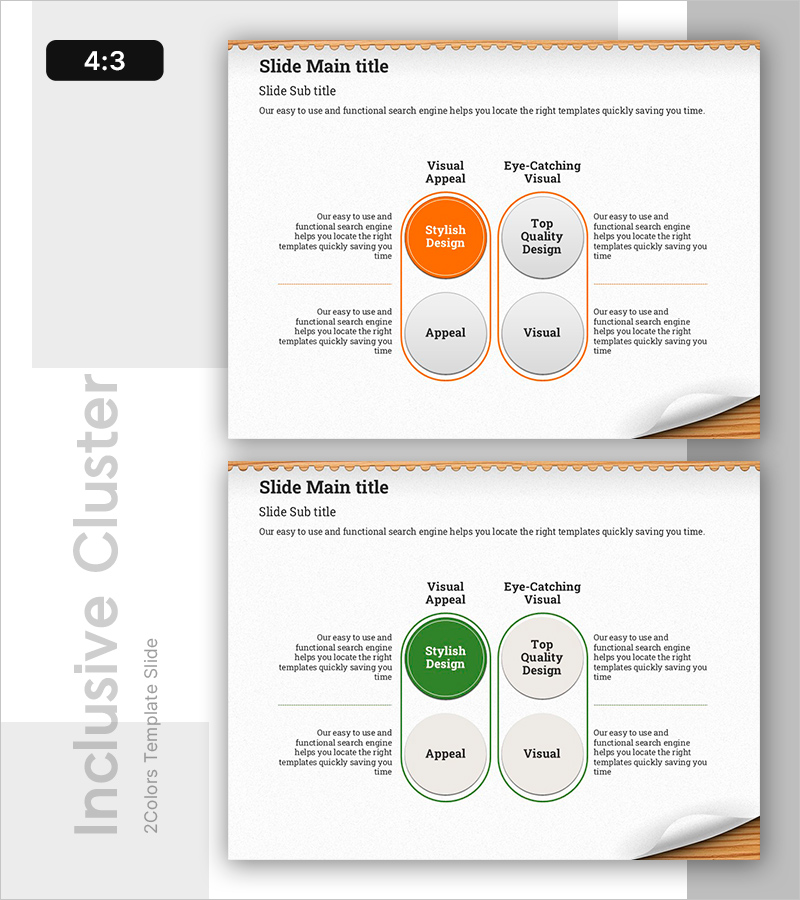
A 4-item nested diagram PowerPoint slide designed to visualize product introduction and composition. The central highlighted area in orange connects to three surrounding gray items via connector lines, clearly expressing hierarchical relationships and interconnections. The orange and gray two-tone color scheme intuitively distinguishes primary and secondary elements, with dedicated text areas for each item enabling immediate use in presentations, product introductions, and business proposals. The 4:3 aspect ratio with 2-slide layout adapts to various presentation environments.
Usage Points
-
Main Usage
Designed to help audiences instantly grasp hierarchical relationships between a product's core function and supporting elements. The central highlighted area positions the main concept while surrounding items express detailed components, conveying logical structure clearly.
-
How to Use
Use in product introduction presentations, service composition explanations, and business model analyses to describe relationships between core and supporting elements. Input specific content into each item's text area to enhance audience comprehension.
-
Recommended For
Recommended for product marketing managers, planners, consultants, and educators who need to explain complex structures simply and effectively. Ideal for startup pitches, corporate briefings, and internal training materials.
-
Slide Structure
2-slide layout. Each slide features one central orange circular node and four surrounding gray circular nodes in a nested structure. Connector lines link the central node to surrounding nodes, with dedicated text areas positioned around each node for information input.
Related Products
-

Business Strategy Inclusion Diagram – Cluster Diffusion Model
#Product/Service Introduction #Business Vision and Strategy #Diagram
-

Key Feature Analysis Slide – Visualizing Product Features
#Product/Service Introduction #Diagram #Features
-

Diagram of Major Course Listings – Emphasizing Educational Value
#Product/Service Introduction #Diagram #Features
-

Orange & Green Inclusion Diagram – Highlighting Product Features
#Product/Service Introduction #Diagram #Features
