Business Key Performance Table Slide – Intuitive Data Comparison
RJ0200019_9
- Last Update 04/02/2025
- File Size 7.2MB
- # of Slides 2
- File Format PPTX
- Slide Ratio 16:9
- Color
Keywords
About the Product
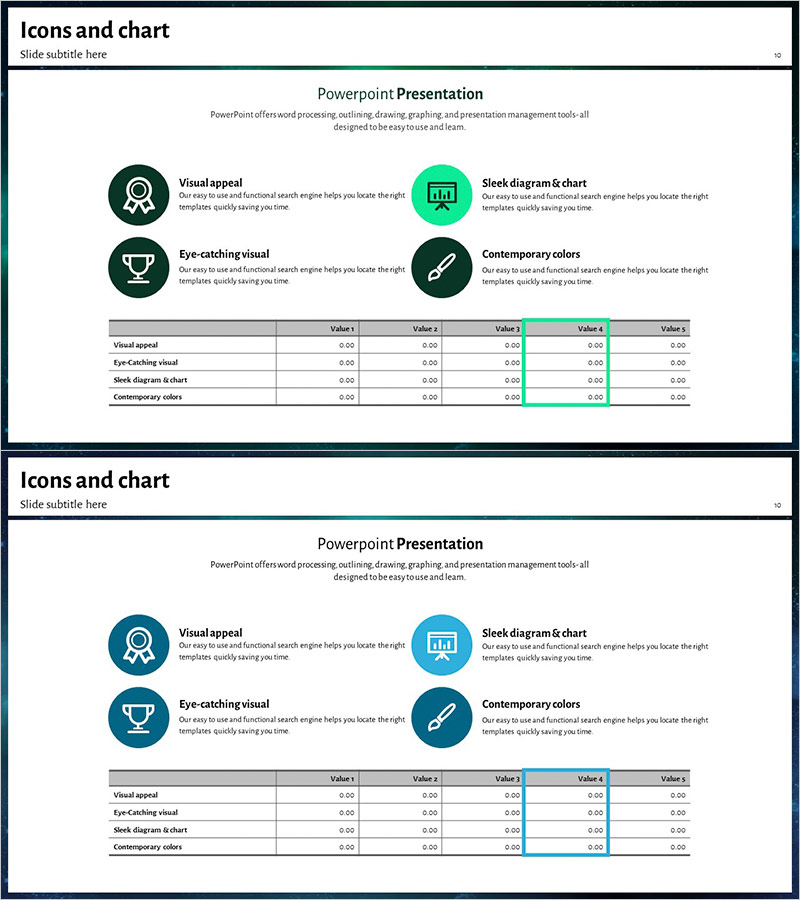
A table-based slide template designed to compare business key performance indicators at a glance. The data table features 5 columns and 4 rows, optimized for numerical comparison and performance analysis. The contemporary color palette combines dark green, turquoise, and white tones to clearly highlight critical information areas. Each cell includes highlight functionality to emphasize key metrics, while integrated icons and text enhance information delivery. This PowerPoint presentation template is ready to use in finance, performance, and operational status sections of your business slides.
Usage Points
-
Main Usage
Organize business key performance indicators (KPIs) and operational data in table format for decision-making presentations. Compare multiple metrics such as financial status, sales performance, customer satisfaction, and project progress across 5 data points. Highlighted cells draw attention to critical achievements and guide audience focus to key insights.
-
How to Use
Apply this slide in business reports, quarterly performance presentations, executive briefings, and investor pitch decks to display core metrics side-by-side. Replace cell values with your actual data and customize rows and columns as needed. Adjust color-highlighted areas to reflect priority levels and create more impactful presentation materials.
-
Recommended For
Ideal for CFOs, finance managers, business unit directors, project managers, and marketing leaders presenting performance analysis and progress updates. Recommended for quarterly and annual business reviews, team performance evaluations, and client proposals requiring credible data visualization across all professional presentations.
-
Slide Structure
Comprises 2 slides, each featuring a 4-row by 5-column table structure (rows: Visual appeal, Eye-catching visual, Sleek diagram & chart, Contemporary colors; columns: Value 1–5). The first slide displays 4 circular icons with dark green background and table layout, while the second slide repeats the same structure with turquoise background, ensuring consistent data representation.
Related Products
-

Sales & Performance Status Slide – Data-Driven Insights
#Company Introduction #Market and Competitor Analysis #Diagram
-

Performance Analysis 3D Bar Chart & Table – Market and Performance Analysis
#Company Introduction #Market and Competitor Analysis #Diagram
-

Presentation Slide Visualizing Company Performance with Column Chart
#Company Introduction #Market and Competitor Analysis #Diagram
-

Performance Competitive Comparison Analysis Chart – Business Performance Analysis
#Company Introduction #Market and Competitor Analysis #Diagram
