Doughnut Slide Visualizing Business Status and Market Share
RJ0400005_5
- Last Update 05/18/2025
- File Size 0.6MB
- # of Slides 2
- File Format PPTX
- Slide Ratio 16:9
- Color
Keywords
- #Content-Based Slides
- #Design-Based Slides
- #Business Introduction
- #Market and Competitor Analysis
- #Graph
- #Market Share
- #Circles
- #Doughnut Chart
- #16:9
- #doughnut chart PowerPoint slide
- #pie chart template download
- #ratio comparison presentation
- #market share visualization
- #data visualization slides
- #business analytics PowerPoint
About the Product
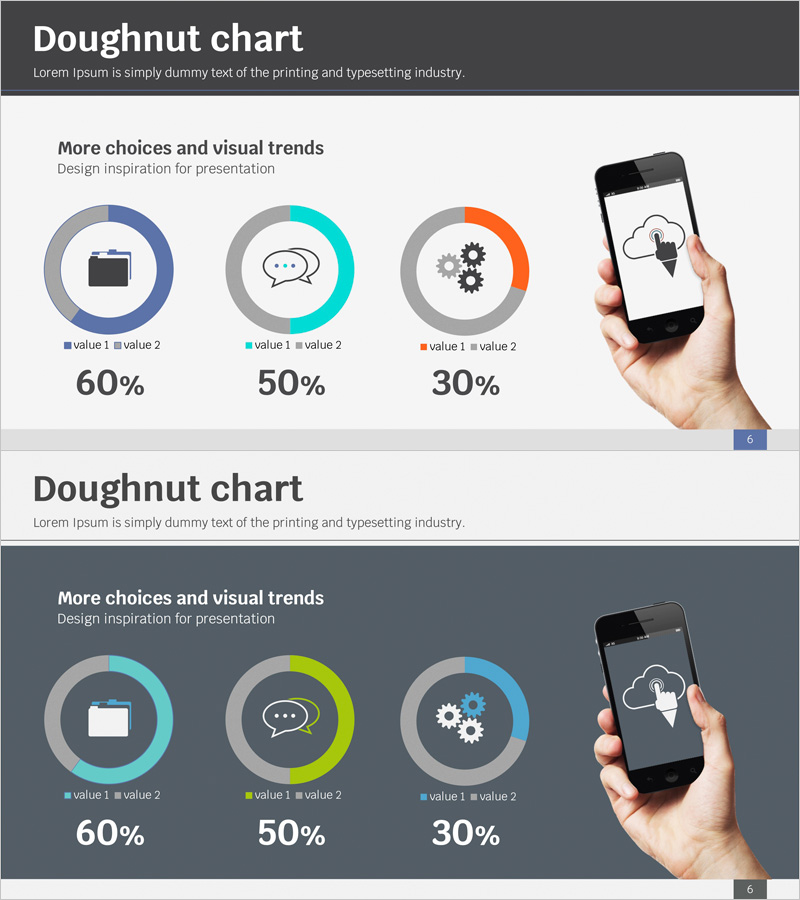
A professional doughnut chart PowerPoint slide template designed to visualize business status and market share distribution. This 2-slide set provides both light and dark background versions for flexible presentation environments. Each slide features three doughnut charts arranged horizontally, with teal, blue, and orange color accents for clear data differentiation. Central icons (briefcase, chat bubble, gear) reinforce the meaning of each data category, while percentage values displayed below ensure quantitative clarity. The template is ready to download and immediately applicable to business reports, strategy presentations, investor pitches, and quarterly performance reviews.
Usage Points
-
Main Usage
Effectively communicates proportional relationships between parts and whole, such as business status, market share, customer composition, and revenue distribution. The central icon area allows symbolic representation of each data category, while percentage values reinforce quantitative credibility and data-driven decision-making.
-
How to Use
Deploy in executive briefings, quarterly business reviews, marketing strategy meetings, and investor presentations to support data-driven discussions. Light background optimizes visibility in bright conference rooms, while dark background suits projection environments with reduced ambient light, allowing flexible adaptation to venue conditions.
-
Recommended For
Executive and C-suite reporting, marketing team market analysis presentations, sales team customer composition analysis, finance team revenue structure explanations, and strategy team business portfolio reviews. Suitable for any business presentation requiring clear quantitative ratio communication.
-
Slide Structure
Two-slide set with three doughnut charts per slide arranged horizontally. Each chart displays two data series (value 1 and value 2) with a central icon area for category emphasis. Percentage values (60%, 50%, 30%) displayed below each chart with accompanying legend ensure clear data interpretation and quantitative accuracy.
Related Products
-

Donut Graph by Caries Erosion Status – Essential for Market Analysis
#Business Introduction #Market and Competitor Analysis #Graph
-

Pie Chart for Data Comparison – Quality and Color
#Business Introduction #Market and Competitor Analysis #Graph
-

Scientific Analysis Donut Circle Graph
#Business Introduction #Market and Competitor Analysis #Graph
-

Visualizing Subjects with Donut Charts – A Master of Information Delivery
#Product/Service Introduction #Business Introduction #Market and Competitor Analysis
