Cosmetics and Flow Circulation Diagram – Technology Development Strategy
RJ0400002_16
- Last Update 05/17/2025
- File Size 2.2MB
- # of Slides 2
- File Format PPTX
- Slide Ratio 16:9
- Color
Keywords
- #Content-Based Slides
- #Design-Based Slides
- #Operational Plan
- #Technical Approach
- #Diagram
- #Production and Technology Development Strategy
- #Service Implementation Plan
- #Flow
- #Circular Flow
- #16:9
- #circular diagram PowerPoint
- #3-step cycle diagram slide
- #arrow flow diagram template
- #process cycle PPT
- #how to create circular diagram in PowerPoint
About the Product
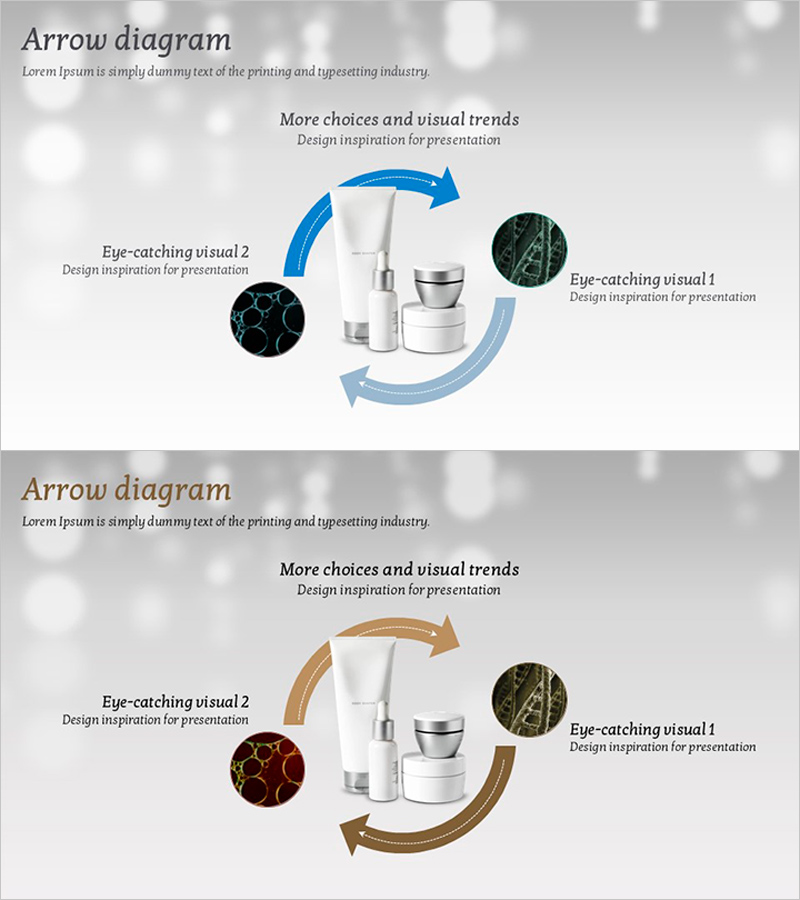
A 3-step circular diagram PowerPoint slide designed to visualize cosmetics technology development strategy. Curved arrows in blue and brown tones connect clockwise around a central product image, clearly expressing the cyclical process. Each stage features dedicated text areas and visual elements (circular image placeholders) to enhance information delivery. The 2-slide set provides color variations (blue/brown) so you can match your presentation tone. Instantly applicable to any presentation requiring cyclical processes such as technology development, service implementation plans, and operational strategies.
Usage Points
-
Main Usage
Optimized for visualizing cyclical processes, cycles, and repetitive structures. Effectively expresses 3+ stage iterative processes including technology development phases, product development cycles, service operation loops, and marketing strategy cycles.
-
How to Use
Insert your product or service image into the central image area. Add process names and descriptions to each stage's text boxes. Enhance visual completeness by adding stage-specific icons or photos to the circular image areas. Select the blue or brown color version that matches your presentation's overall tone and design theme.
-
Recommended For
Ideal for cosmetics, beauty, and pharmaceutical technology development presentations; manufacturing production process explanations; IT and software development cycle introductions; marketing team campaign strategy cycles; operations team service improvement loop descriptions; and consulting proposal implementation strategy visualizations.
-
Slide Structure
2-slide set. Each slide contains 1 central product image, 3-stage clockwise curved arrows, 3 text boxes per stage, and 3 circular image placeholder areas. Provided in blue tone (top) and brown tone (bottom) color variations for flexible design matching with your presentation materials.
Related Products
-

Tool Icons and Diffusion Diagrams – Visualizing Technical Processes
#Operational Plan #Technical Approach #Diagram
-

A Cyclical Process for Continuous Improvement
#Operational Plan #Technical Approach #Diagram
-

System Cycle Diagram - Effective Process Visualization for Operational Planning
#Operational Plan #Technical Approach #Diagram
-

Cyclical Interaction of Natural Energy Flows
#Technical Approach #Corporate Social Responsibility #Diagram
