Flow Diagram for Galaxy Theme Product Strategy
RJ0400001_16
- Last Update 05/17/2025
- File Size 13.8MB
- # of Slides 2
- File Format PPTX
- Slide Ratio 16:9
- Color
Keywords
- #Content-Based Slides
- #Design-Based Slides
- #Operational Plan
- #Marketing Plan and Strategy
- #Diagram
- #Production and Technology Development Strategy
- #Flow
- #Linear Flow
- #16:9
- #linear flow diagram PowerPoint
- #5-step process slide
- #galaxy theme presentation
- #product strategy diagram
- #how to create process flow in PowerPoint
About the Product
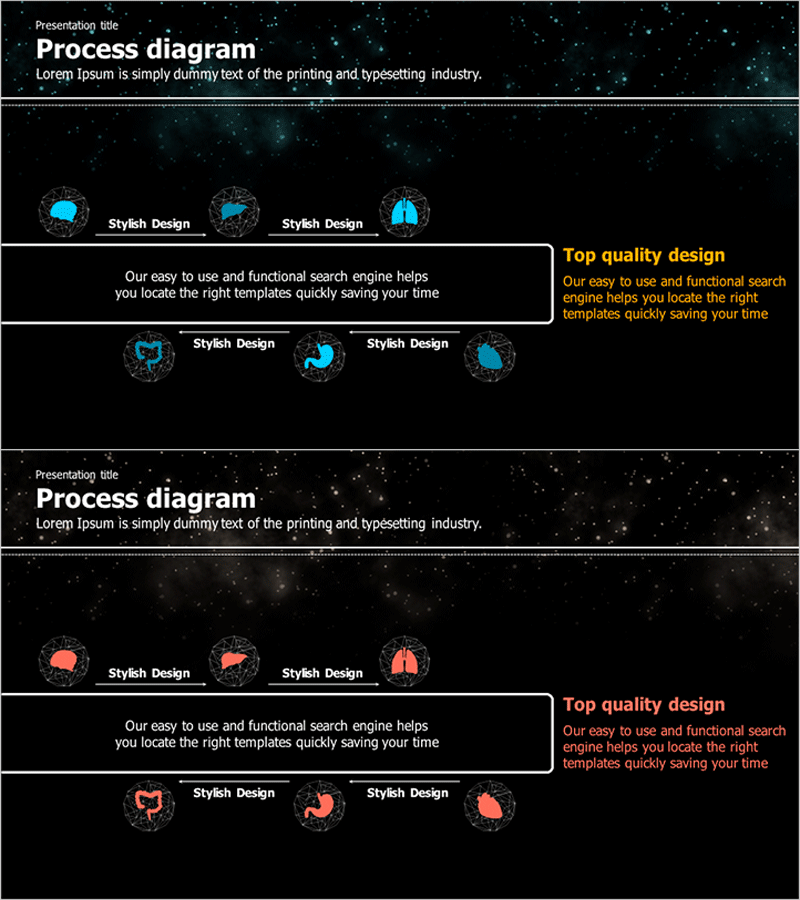
A 5-step linear flow diagram PowerPoint slide with galaxy theme design. Set against a dark starry background, cyan and orange circular icons represent sequential process stages, connected by directional arrows. Ideal for visualizing product strategy, marketing plans, and operational workflows. The slide deck includes 2 layouts (16:9 aspect ratio, PPTX format) with fully editable elements. Perfect for technology, marketing, and operations presentations requiring clear process visualization.
Usage Points
-
Main Usage
Designed to clearly visualize sequential processes in product development, marketing, and operations. Five nodes connected linearly represent the progression from process initiation to completion, enabling intuitive understanding of workflow stages.
-
How to Use
Use in product strategy presentations, marketing plan explanations, and operational process sharing. Edit node text to reflect actual stage names and customize icon colors to match your brand identity. Fully compatible with PowerPoint editing tools.
-
Recommended For
Recommended for product managers, marketing professionals, operations managers, and executives preparing business presentations. Suitable for technical roadmaps, project timelines, and any business process explanation requiring visual clarity.
-
Slide Structure
2-slide layout. First slide features 5 nodes arranged linearly with connecting arrows. Second slide presents the same structure with additional text boxes for detailed descriptions. Each node consists of a circular icon (cyan or orange) with editable labels, connected by directional arrows indicating process flow.
Related Products
-

Service Distribution Strategy – Operations and Marketing Plan
#Operational Plan #Marketing Plan and Strategy #Diagram
-

The Journey from Harvest to Production – Flow and Strategy
#Operational Plan #Marketing Plan and Strategy #Diagram
-

Magic Analysis Chart for Visualizing Operations and Marketing Goals
#Operational Plan #Marketing Plan and Strategy #Diagram
-

Marketing Goals Flow Diagram – Efficient Strategy Development
#Marketing Plan and Strategy #Diagram #Marketing Objectives
