Corn Composition Analysis Table – Market Analysis and Financial Performance
RJ0400031_10
- Last Update 05/25/2025
- File Size 8MB
- # of Slides 2
- File Format PPTX
- Slide Ratio 16:9
- Color
Keywords
- #Content-Based Slides
- #Design-Based Slides
- #Market and Competitor Analysis
- #Financial Plans and Performance
- #Diagram
- #Market Analysis
- #Capital Requirements
- #Table
- #Standard Table
- #16:9
- #comparison table PowerPoint slide
- #data visualization template
- #market analysis table
- #6-column table slide
- #financial data table template
- #how to create comparison table in PowerPoint
About the Product
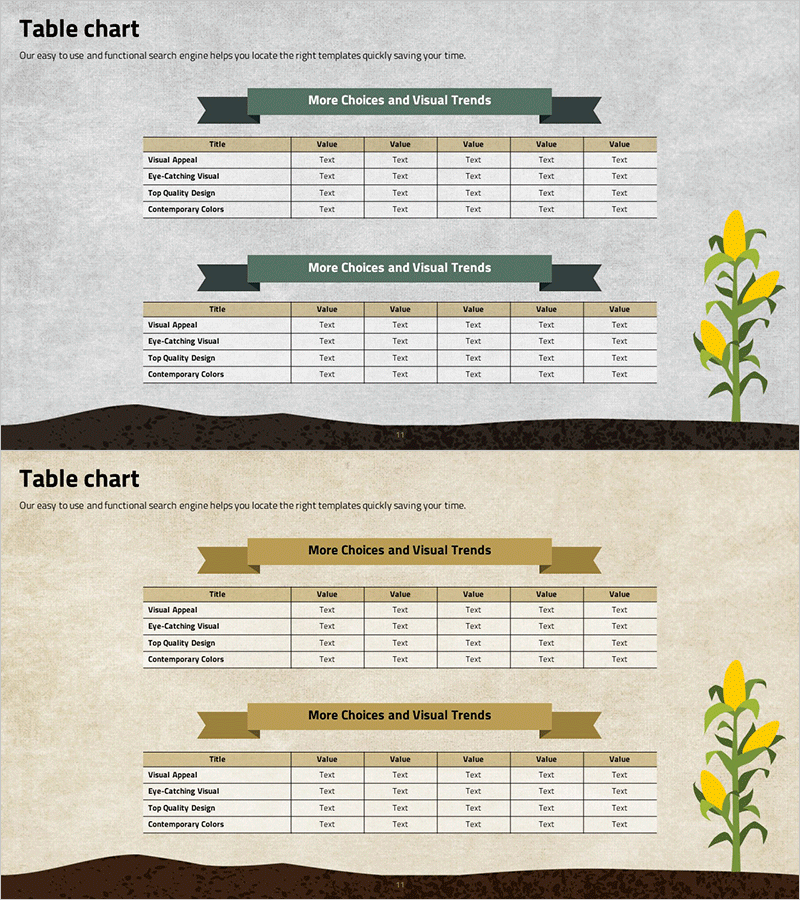
A professional 6-column comparison table PowerPoint slide designed for presenting market analysis and financial performance data. Features two color schemes—dark green and beige tones—with ribbon banner headers and decorative illustration elements. Each table includes a header row and four data rows for structured information display. Ideal for competitive analysis, component comparison, financial metrics, and multi-factor data presentation. Ready-to-use slide template for business reports, investment pitches, and strategic presentations.
Usage Points
-
Main Usage
Presents quantitative data in a structured matrix format for side-by-side comparison and analysis. Ideal for competitive benchmarking, product component analysis, financial performance metrics, market segmentation data, and multi-criteria evaluation.
-
How to Use
Simply input your data into each cell. Customize the ribbon banner title to match your analysis topic and replace row labels (Visual Appeal, Eye-Catching Visual, etc.) with your actual comparison categories. Choose between two color theme options to match your presentation style.
-
Recommended For
Marketing strategy presentations, business analysis reports, investor pitch decks, product introduction slides, executive summary documents. Suitable for finance teams, marketing departments, strategic planning units, and sales professionals presenting data-driven insights.
-
Slide Structure
Two-slide set with consistent layout: ribbon banner header (title area), 6-column × 5-row table (header row plus four data rows), and decorative illustration element on the right. First slide features dark green tones; second slide uses beige tones for flexible document integration.
Related Products
-

Galaxy Theme Market Analysis Horizontal Table
#Market and Competitor Analysis #Financial Plans and Performance #Diagram
-

Estimated Budget Breakdown – Financial Planning and Budget Management
#Financial Plans and Performance #Diagram #Capital Requirements
-

Visualizing Market Analysis and Performance with Reading Learning Table Charts
#Market and Competitor Analysis #Financial Plans and Performance #Diagram
-

Pentagon Diagram & Table Chart – Market Analysis and Competitive Insight
#Market and Competitor Analysis #Diagram #Market Analysis
