Market Share Analysis Donut Chart – Competitive Edge in the Market
RJ0300097_5
- Last Update 05/16/2025
- File Size 0.3MB
- # of Slides 2
- File Format PPTX
- Slide Ratio 16:9
- Color
Keywords
- #Content-Based Slides
- #Design-Based Slides
- #Product/Service Introduction
- #Market and Competitor Analysis
- #Graph
- #Development Status
- #Market Share
- #Circles
- #Doughnut Chart
- #16:9
- #donut chart PowerPoint
- #pie chart slide template
- #market share analysis presentation
- #donut graph template download
- #data visualization PPT
- #competitive analysis slide
About the Product
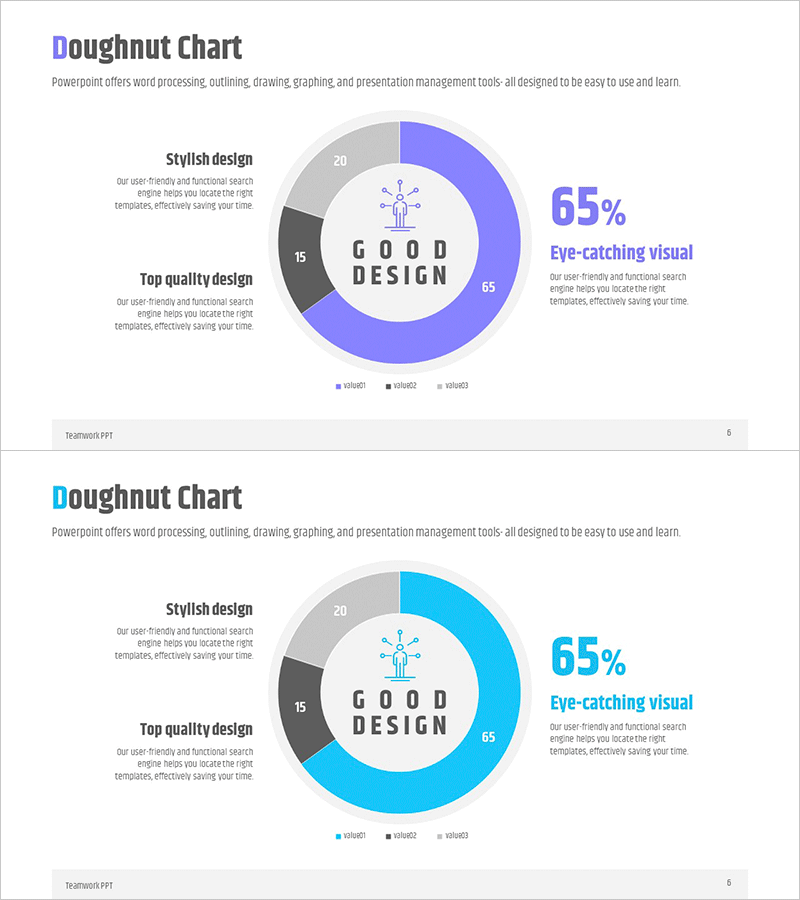
A donut chart PowerPoint slide designed for market share and competitive analysis presentations. The design emphasizes a central key metric (65%) while displaying three data categories in distinct colors around the outer ring. The blue, gray, and dark tone color scheme creates a professional appearance suitable for product introduction and market analysis presentations. This 2-slide template in 16:9 widescreen format effectively communicates data alongside descriptive text for various business scenarios.
Usage Points
-
Main Usage
Visualizes market share, product category ratios, and competitive analysis data with a central emphasis on key metrics (65%) while simultaneously displaying three surrounding segments. This dual-focus design allows audiences to grasp both the dominant metric and comparative proportions at a glance.
-
How to Use
Apply this template to product introduction presentations, market analysis reports, and competitive advantage discussions. Simply edit the numerical values and labels in each segment to match your data, then add your analysis text in the accompanying text boxes to create a polished presentation.
-
Recommended For
Marketing professionals, sales executives, and business strategists presenting market conditions and product competitiveness. Ideal for investor pitch meetings, client proposals, and internal strategy sessions where data-driven decision-making is essential.
-
Slide Structure
Two-slide template featuring a blue-toned donut chart on the first slide and a cyan-toned version on the second. Each slide displays a central circular area with a key metric and icon, surrounded by a donut ring divided into three data segments (65%, 15%, 20%) in distinct colors. Two text description boxes on the left side accommodate analytical commentary and supporting information.
Related Products
-

Development Status Analysis Donut Chart – Market Share Visualization
#Product/Service Introduction #Market and Competitor Analysis #Graph
-

Doughnut Chart Visualizing Current Status of 3D Printing Technology Development
#Product/Service Introduction #Market and Competitor Analysis #Graph
-

City Theme Market Share Graph – Business Data Visualization
#Product/Service Introduction #Market and Competitor Analysis #Graph
-

Sales Status Analysis Graph – Simple and Stylish Design
#Product/Service Introduction #Market and Competitor Analysis #Graph
