Business Investment Idea Analysis Circle Graph – Visualizing Market Share
RJ0300095_27
- Last Update 05/16/2025
- File Size 0.3MB
- # of Slides 2
- File Format PPTX
- Slide Ratio 16:9
- Color
Keywords
- #Content-Based Slides
- #Design-Based Slides
- #Product/Service Introduction
- #Market and Competitor Analysis
- #Graph
- #Development Status
- #Market Share
- #Circles
- #Doughnut Chart
- #16:9
- #donut chart PowerPoint slide
- #pie chart template
- #market share visualization
- #investment proportion diagram
- #donut graph presentation template
About the Product
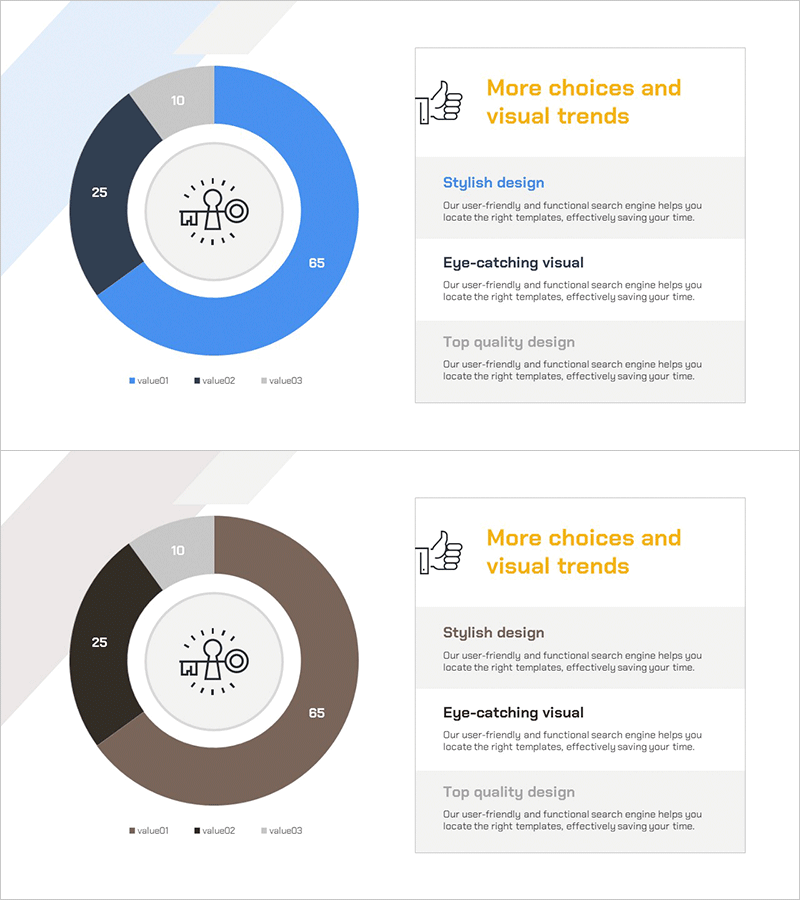
A donut chart PowerPoint slide designed for business investment idea analysis and market share visualization. This presentation template features a central icon area surrounded by a three-segment donut chart in blue, dark navy, and gray tones, enabling clear data differentiation. The slide deck includes two versions with contrasting background colors—blue and brown—allowing flexible adaptation to your presentation theme. Each segment displays numerical values (65, 25, 10) representing investment proportions, market segments, or business composition ratios. The 2-slide set is ready for immediate use in investor pitch decks, business analysis reports, and strategic planning presentations without requiring additional design work.
Usage Points
-
Main Usage
Visualize business investment portfolio composition, market share distribution, and investment allocation ratios using a three-segment donut chart. The central icon area emphasizes key messages or brand symbols, while the three outer segments clearly differentiate primary business categories or market segments with numerical data representation.
-
How to Use
Use this slide in investor pitch presentations to explain portfolio composition, or in business analysis reports to present current market share status. The blue background version suits formal corporate presentations, while the brown background version works well for warm-toned seminar materials. Edit segment values and labels to match your actual data and customize the central icon area with your company logo or key message.
-
Recommended For
Investment managers, business planning teams, marketing strategists, and executives presenting portfolio analysis, market positioning, or investment allocation strategies. Ideal for startup funding pitches, corporate business analysis reports, quarterly performance reviews, and strategic planning presentations where data-driven visualization is essential.
-
Slide Structure
Two-slide set featuring blue and brown background versions. Each slide contains a central circular icon area with a three-segment donut chart displaying data values (65, 25, 10). Designed in 16:9 widescreen format for compatibility with modern projectors and digital displays. All text and numerical labels are fully editable for customization.
Related Products
-

Analysis of Work Progress – Utilizing Pie Chart
#Product/Service Introduction #Market and Competitor Analysis #Graph
-

Development Status Analysis Donut Chart – Market Share Visualization
#Product/Service Introduction #Market and Competitor Analysis #Graph
-

Business Idea Development Status Graph – Ideas and Growth
#Product/Service Introduction #Market and Competitor Analysis #Graph
-

Financial Business Analysis Pie Chart – Market Share Insights
#Product/Service Introduction #Market and Competitor Analysis #Graph
